
















©The Author(s) 2004.
World J Gastroenterol. Aug 15, 2004; 10(16): 2427-2429
Published online Aug 15, 2004. doi: 10.3748/wjg.v10.i16.2427
Published online Aug 15, 2004. doi: 10.3748/wjg.v10.i16.2427
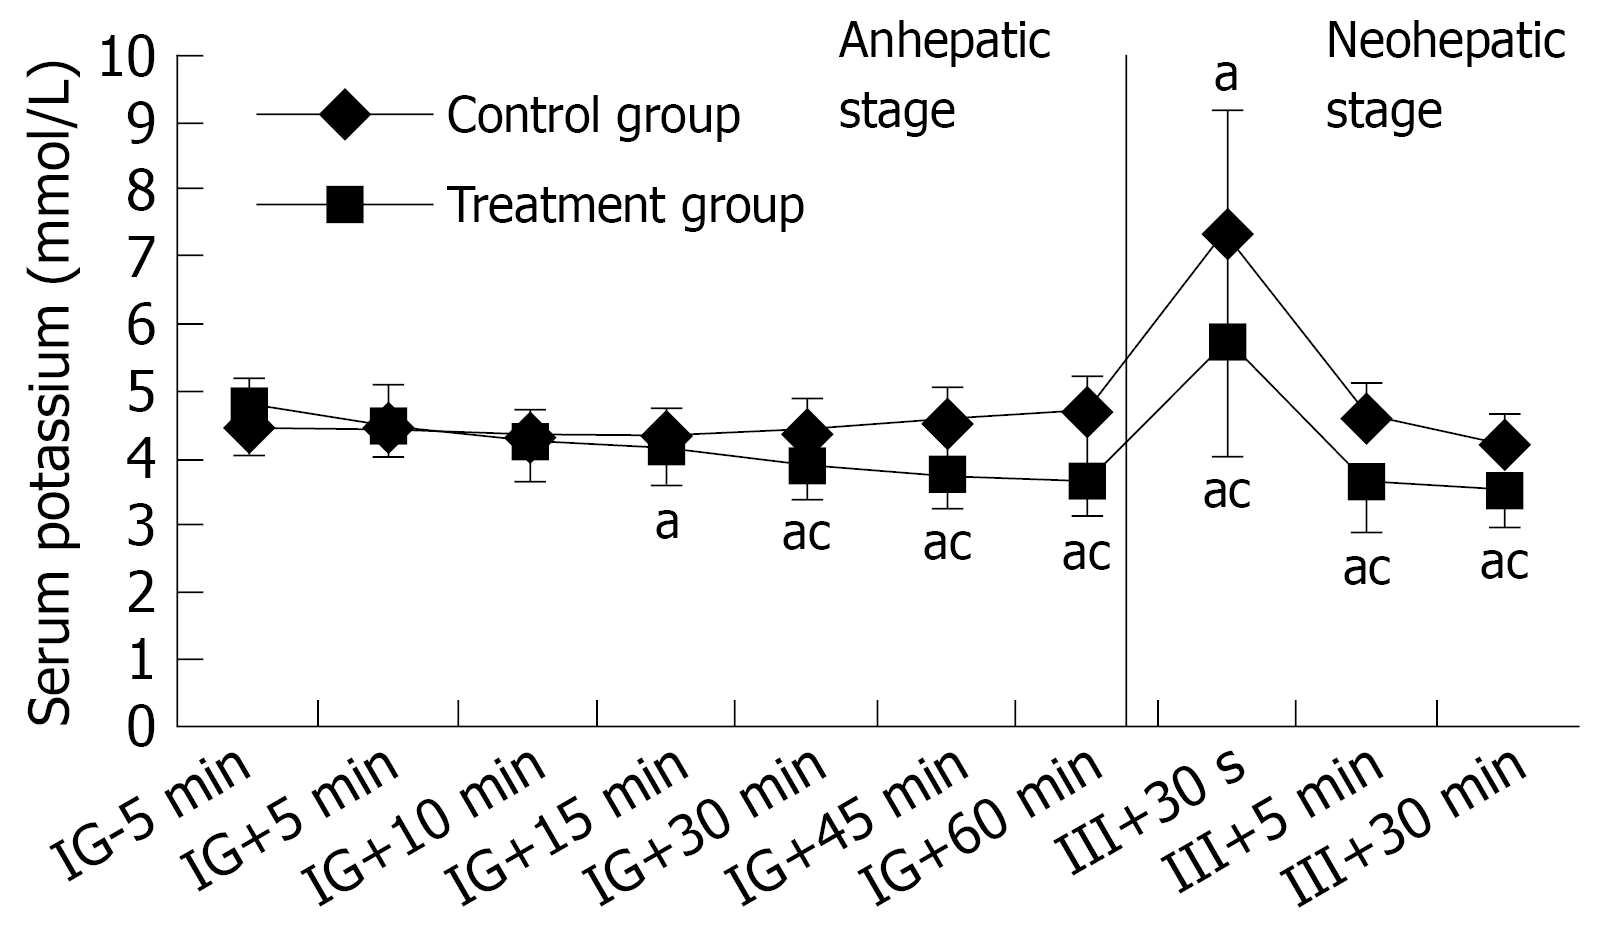
Figure 1 Serum potassium concentration during liver transplantation in the control group and treatment group.
aP < 0.05 compared with IG-5′; cP < 0.05 compared with control group. IG represents insulin and glucose treatment and III stands for neohepatic stage (n = 8).
- Citation: Li Q, Zhou MT, Wang Y, Liu YH, Yang LQ, Zhu M, Yu WF, Yang GS. Effect of insulin on hyperkalemia during anhepatic stage of liver transplantation. World J Gastroenterol 2004; 10(16): 2427-2429
- URL: https://www.wjgnet.com/1007-9327/full/v10/i16/2427.htm
- DOI: https://dx.doi.org/10.3748/wjg.v10.i16.2427