Copyright
©The Author(s) 2004.
World J Gastroenterol. Jun 1, 2004; 10(11): 1608-1611
Published online Jun 1, 2004. doi: 10.3748/wjg.v10.i11.1608
Published online Jun 1, 2004. doi: 10.3748/wjg.v10.i11.1608
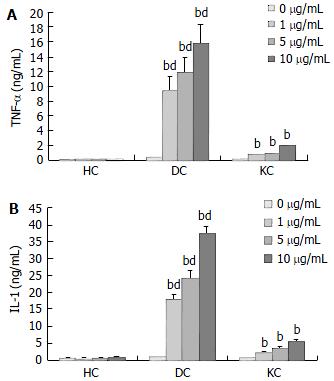
Figure 2 Changes of TNF-α and IL-1 levels in culture superna-tants of HC, DC, KC after 4 h and 24 h incubation with various concentrations of LPS (n = 3, mean ± SD).
bP < 0.01 for TNF-α and IL-1 levels in DC, KC vs control; dP < 0.01 for DC coculture vs other cultures after 0, 1, 5, and 10 µg/mL LPS. A: Changes of TNF-α levels in culture supernatants of HC, DC, KC after 4 h incubation with various concentrations of LPS. B: Changes of IL-1 levels in culture supernatants of HC, DC, KC after 24 h incubation with various concentrations of LPS.
- Citation: Yao HW, Li J, Chen JQ, Xu SY. Leflunomide attenuates hepatocyte injury by inhibiting Kupffer cells. World J Gastroenterol 2004; 10(11): 1608-1611
- URL: https://www.wjgnet.com/1007-9327/full/v10/i11/1608.htm
- DOI: https://dx.doi.org/10.3748/wjg.v10.i11.1608


