Copyright
©The Author(s) 2004.
World J Gastroenterol. Jun 1, 2004; 10(11): 1578-1582
Published online Jun 1, 2004. doi: 10.3748/wjg.v10.i11.1578
Published online Jun 1, 2004. doi: 10.3748/wjg.v10.i11.1578
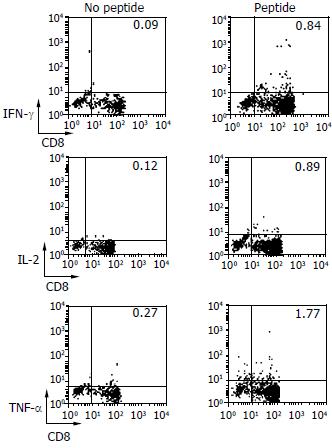
Figure 4 Cytokine secretion of peptide-reactive T cells induced by DCs from one CHB patient.
T cells from one CHB patient was incubated with autologous DCs pulsed with the HBV-specific peptide HBcAg 18-27 (Peptide) or without peptide (No peptide), and T cell response was detected by flow cytometry by measuring cytokine secretion by the activated T cells. The dot-plots show levels of intracellular staining for IFN-γ, IL-2 and TNF-α (y-axis) and surface CD8 molecule (x-axis). The number in the upper-right quadrant indicates the percentage of CD8-positive T cells that secret cytokines.
- Citation: Li RB, Chen HS, Xie Y, Fei R, Cong X, Jiang D, Wang SX, Wei L, Wang Y. Dendritic cells from chronic hepatitis B patients can induce HBV antigen-specific T cell responses. World J Gastroenterol 2004; 10(11): 1578-1582
- URL: https://www.wjgnet.com/1007-9327/full/v10/i11/1578.htm
- DOI: https://dx.doi.org/10.3748/wjg.v10.i11.1578


