Copyright
©The Author(s) 2004.
World J Gastroenterol. May 15, 2004; 10(10): 1440-1446
Published online May 15, 2004. doi: 10.3748/wjg.v10.i10.1440
Published online May 15, 2004. doi: 10.3748/wjg.v10.i10.1440
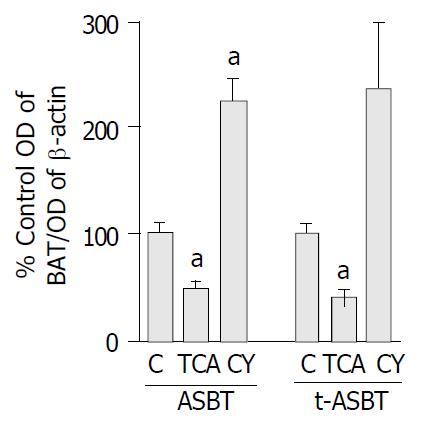
Figure 2 Effect of TCA and CY feeding on the expression of ASBT and t-ASBT protein in cholangiocytes.
Bar graphs show-ing densitometric ratios of ASBT and t-ASBT standardized to β-actin in PNS fractions of freshly isolated cholangiocytes from rats fed control (C), 1% TCA or 5% CY incorporated diet. A 80 μg for ASBT and 120 μg for t-ASBT PNS protein were sub-jected to SDS-PAGE, immunoblotted for ASBT (48 kDa), t-ASBT (19 kDa) and β-Actin (41 kDa) and the bands were then visualized using enhanced chemiluminescence techniques. Densitometric values shown here are expressed as mean ± SE (aP < 0.05) and represent 3 feeding studies for ASBT protein analyses of the TCA and CY groups. Similarly, 3 feeding studies were per-formed to reflect the data obtained on t-ASBT protein follow-ing CY feeding, but only 2 feeding studies were done for t-ASBT protein analysis of the TCA group. Ten rats per group were analyzed in each of these feeding studies, thus a total of 30 rats per feeding study were used in all of the above groups, whereas 20 rats were incorporated into the analysis of t-ASBT in the TCA group.
- Citation: Kip NS, Lazaridis KN, Masyuk AI, Splinter PL, Huebert RC, LaRusso NF. Differential expression of cholangiocyte and ileal bile acid transporters following bile acid supplementation and depletion. World J Gastroenterol 2004; 10(10): 1440-1446
- URL: https://www.wjgnet.com/1007-9327/full/v10/i10/1440.htm
- DOI: https://dx.doi.org/10.3748/wjg.v10.i10.1440


