Copyright
©The Author(s) 2004.
World J Gastroenterol. May 15, 2004; 10(10): 1415-1420
Published online May 15, 2004. doi: 10.3748/wjg.v10.i10.1415
Published online May 15, 2004. doi: 10.3748/wjg.v10.i10.1415
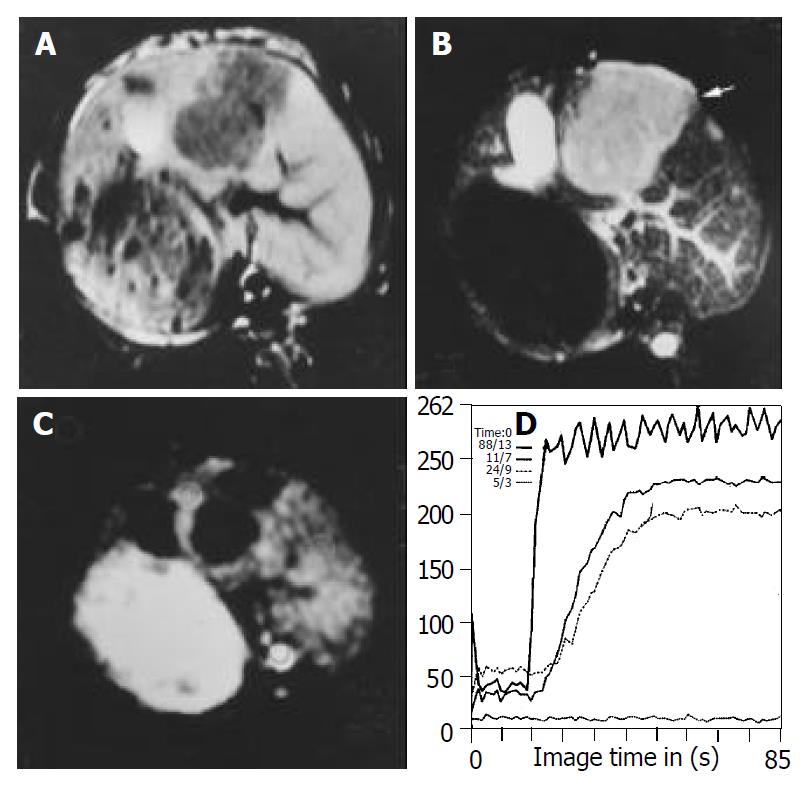
Figure 1 Images obtained before treatment in control group.
A: T1WI shows hypointense lesions in left lobe of the liver. B: T2WI shows homogeneous hyperintense lesions in left lobe of the liver. C: FP T1-weighted image with gadolinium shows rim enhance-ment and no enhancement in the center of lesion. D: Signal intensity time curve derived from FP, SS of the curve in the border of the lesion is steeper than that of the normal liver.
- Citation: Zhao JG, Feng GS, Kong XQ, Li X, Li MH, Cheng YS. Changes of tumor microcirculation after transcatheter arterial chemoembolization: First pass perfusion MR imaging and Chinese ink casting in a rabbit model. World J Gastroenterol 2004; 10(10): 1415-1420
- URL: https://www.wjgnet.com/1007-9327/full/v10/i10/1415.htm
- DOI: https://dx.doi.org/10.3748/wjg.v10.i10.1415


