Copyright
©The Author(s) 2021.
World J Gastroenterol. Mar 7, 2021; 27(9): 854-865
Published online Mar 7, 2021. doi: 10.3748/wjg.v27.i9.854
Published online Mar 7, 2021. doi: 10.3748/wjg.v27.i9.854
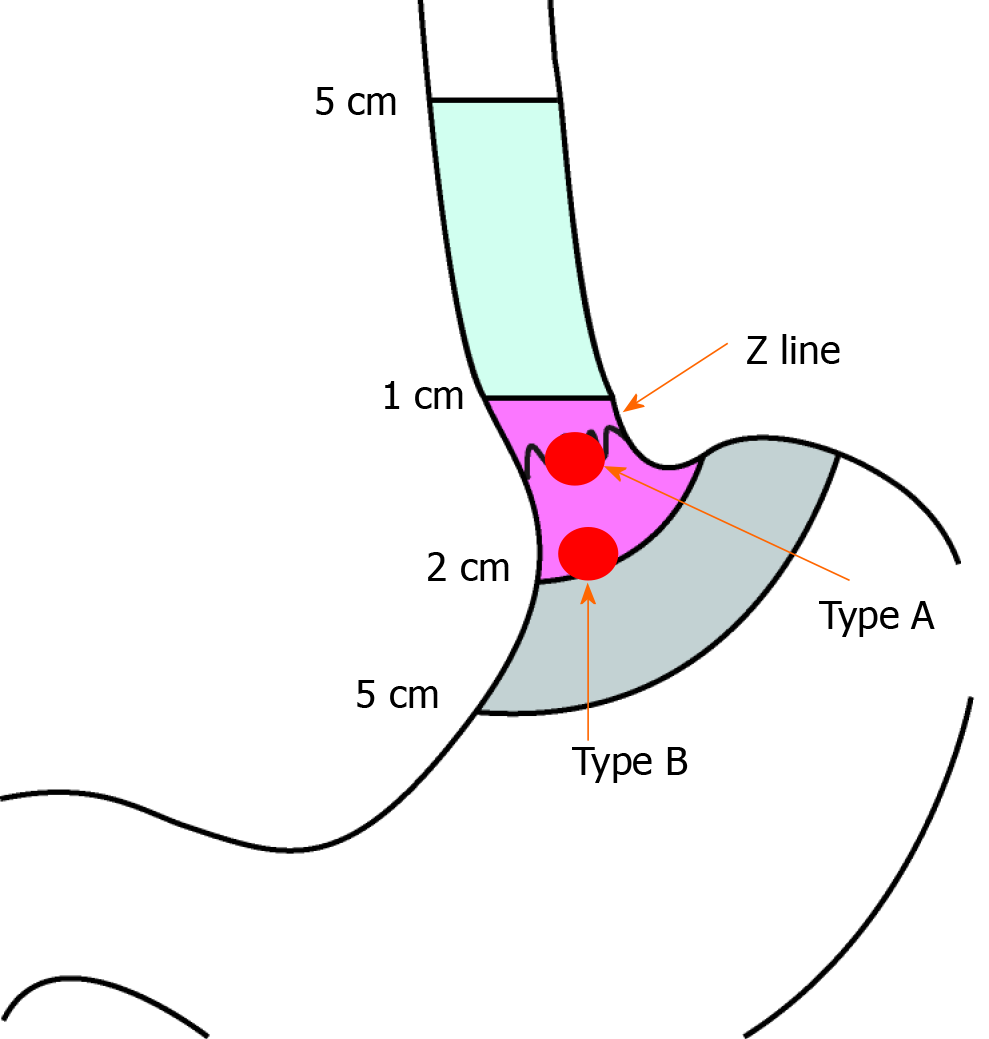
Figure 1 Schematic diagram of esophagogastric junction-gastrointestinal stromal tumor.
Z-line: Squamocolumnar junction; Type A: Defined as esophagogastric junction-gastrointestinal stromal tumor involving Z-line; Type B: Defined as esophagogastric junction-gastrointestinal stromal tumor near Z-line.
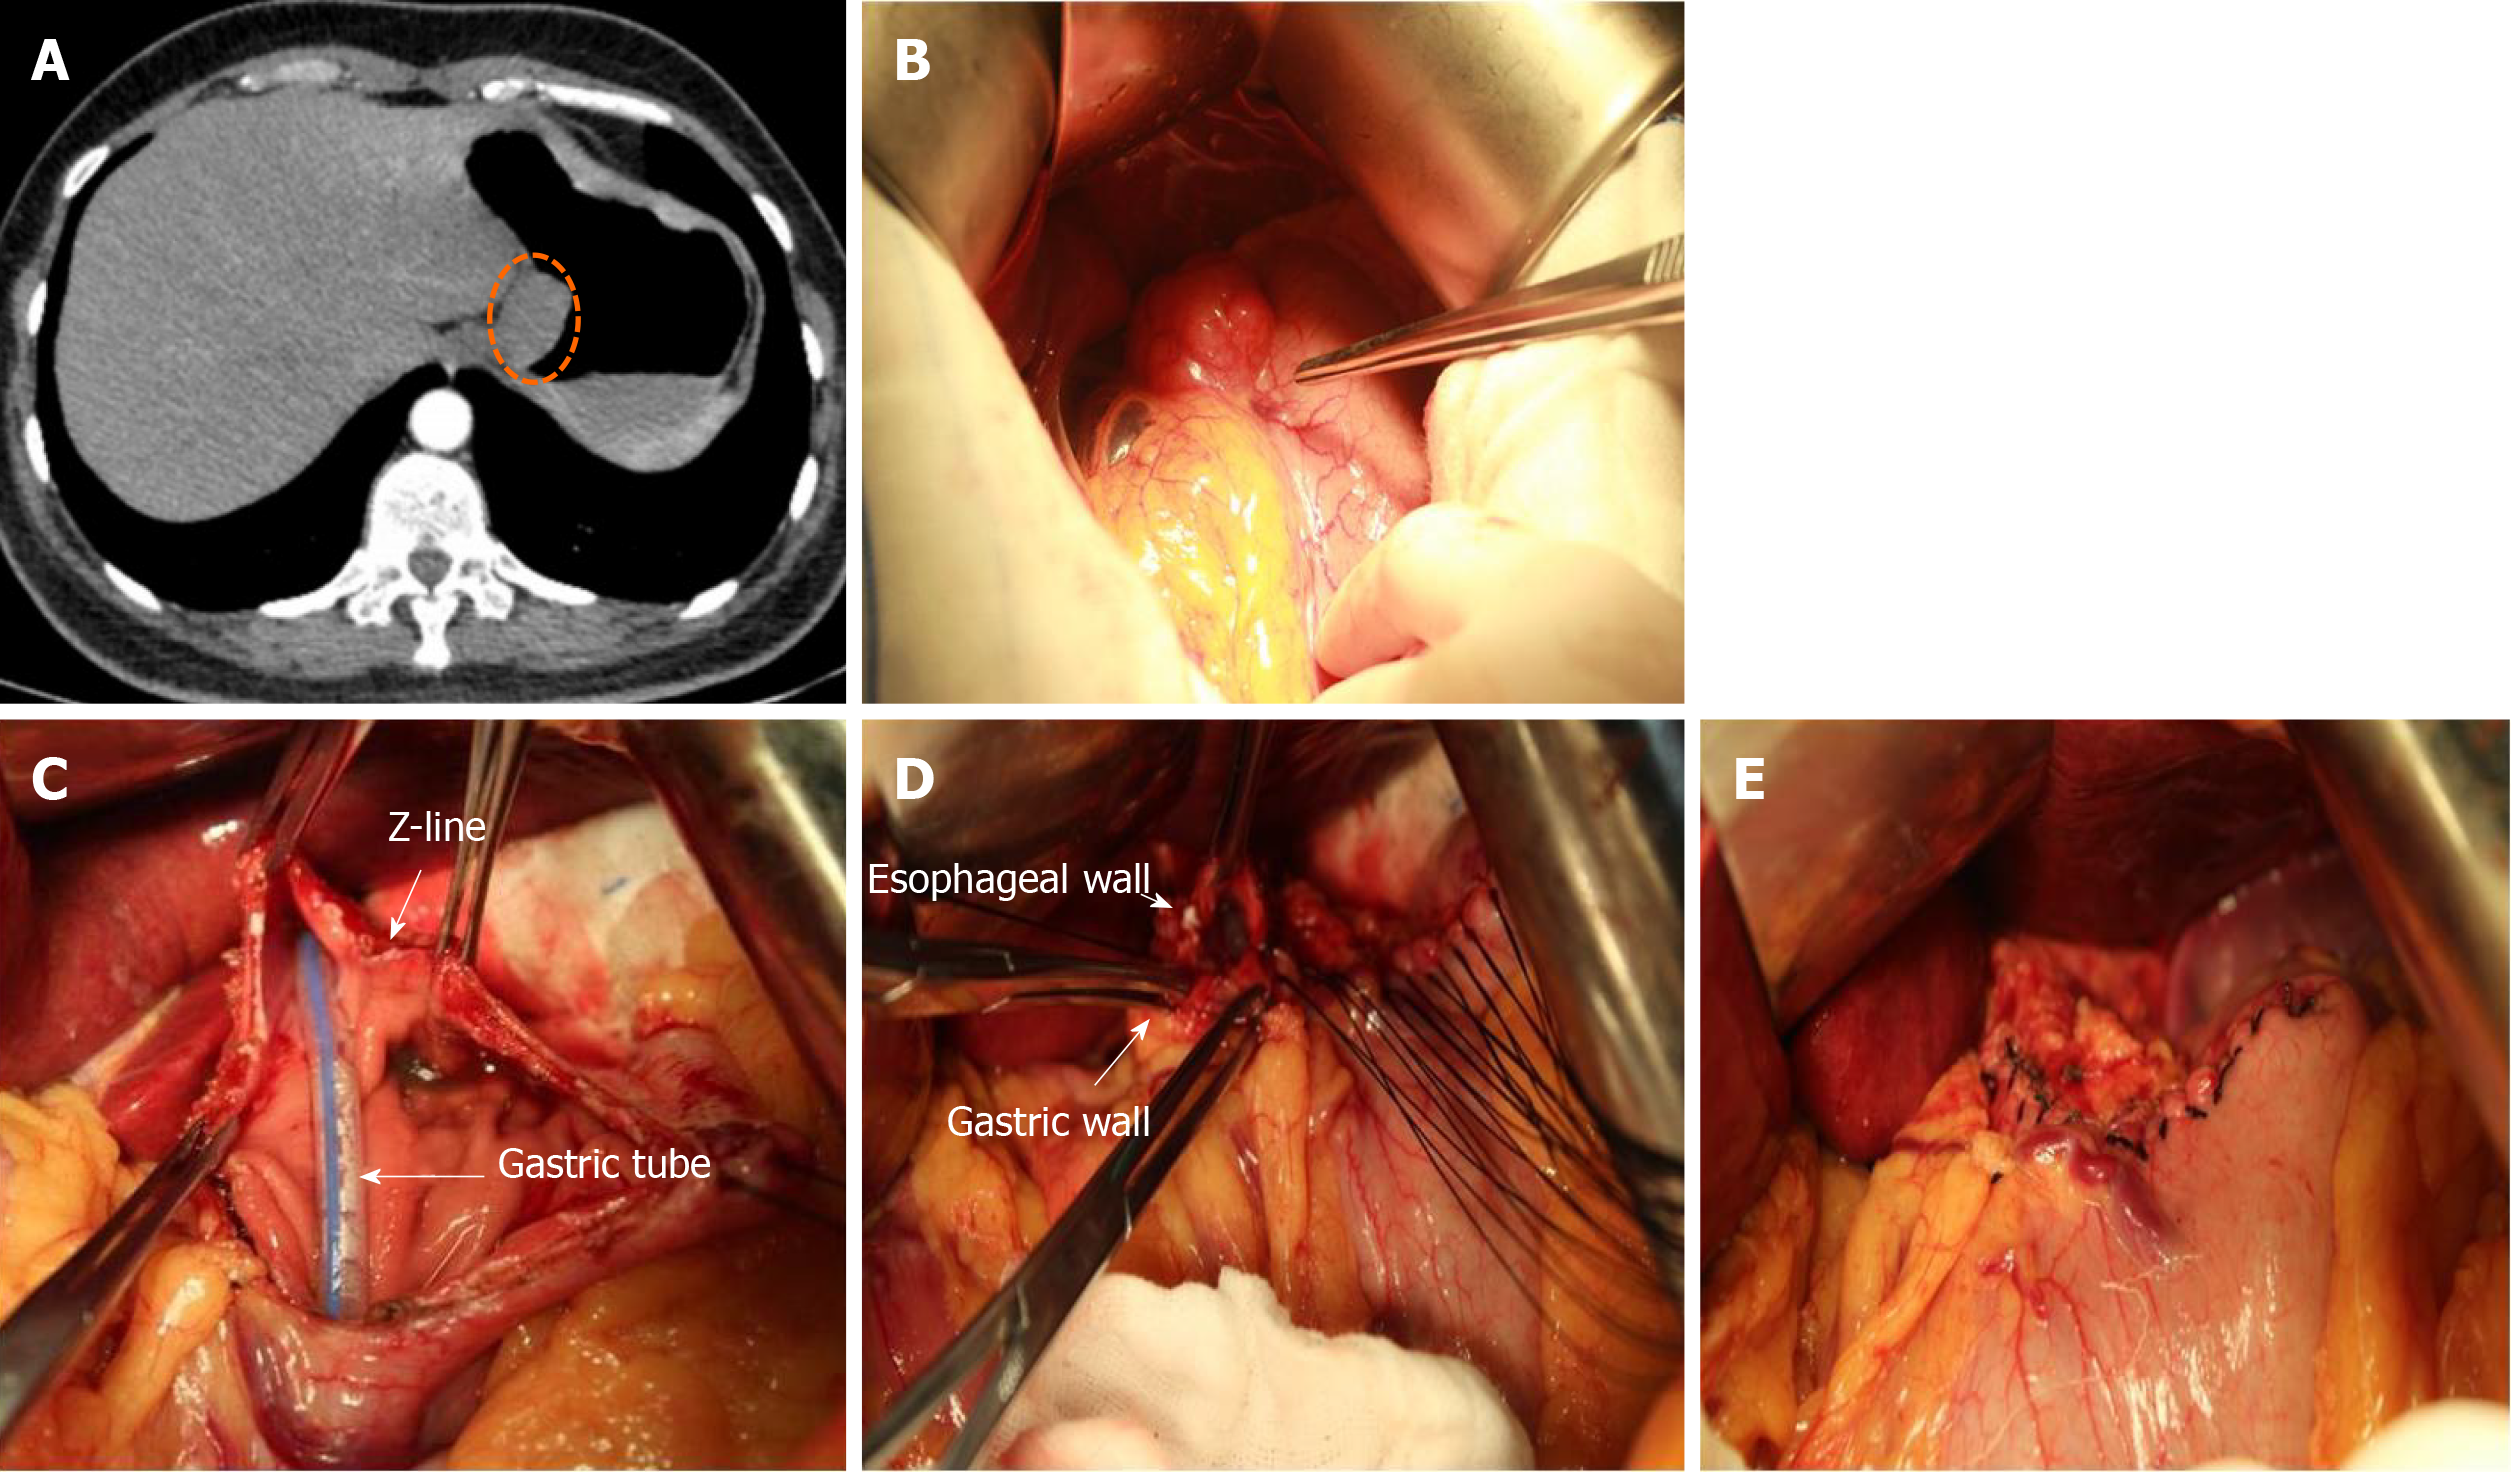
Figure 2 Conformal resection of type A esophagogastric junction-gastrointestinal stromal tumor located in the anterior wall of esophagogastric junction.
A: The abdominal computed tomography showing the lesion located in the anterior wall of the esophagogastric junction; B: Exploratory laparotomy; C: Removal of the tumor with preservation of esophagogastric junction and esophageal wall as much as possible; D: Suturing of the esophageal wall to the gastric wall to prevent stenosis; E: The final appearance after suturing.
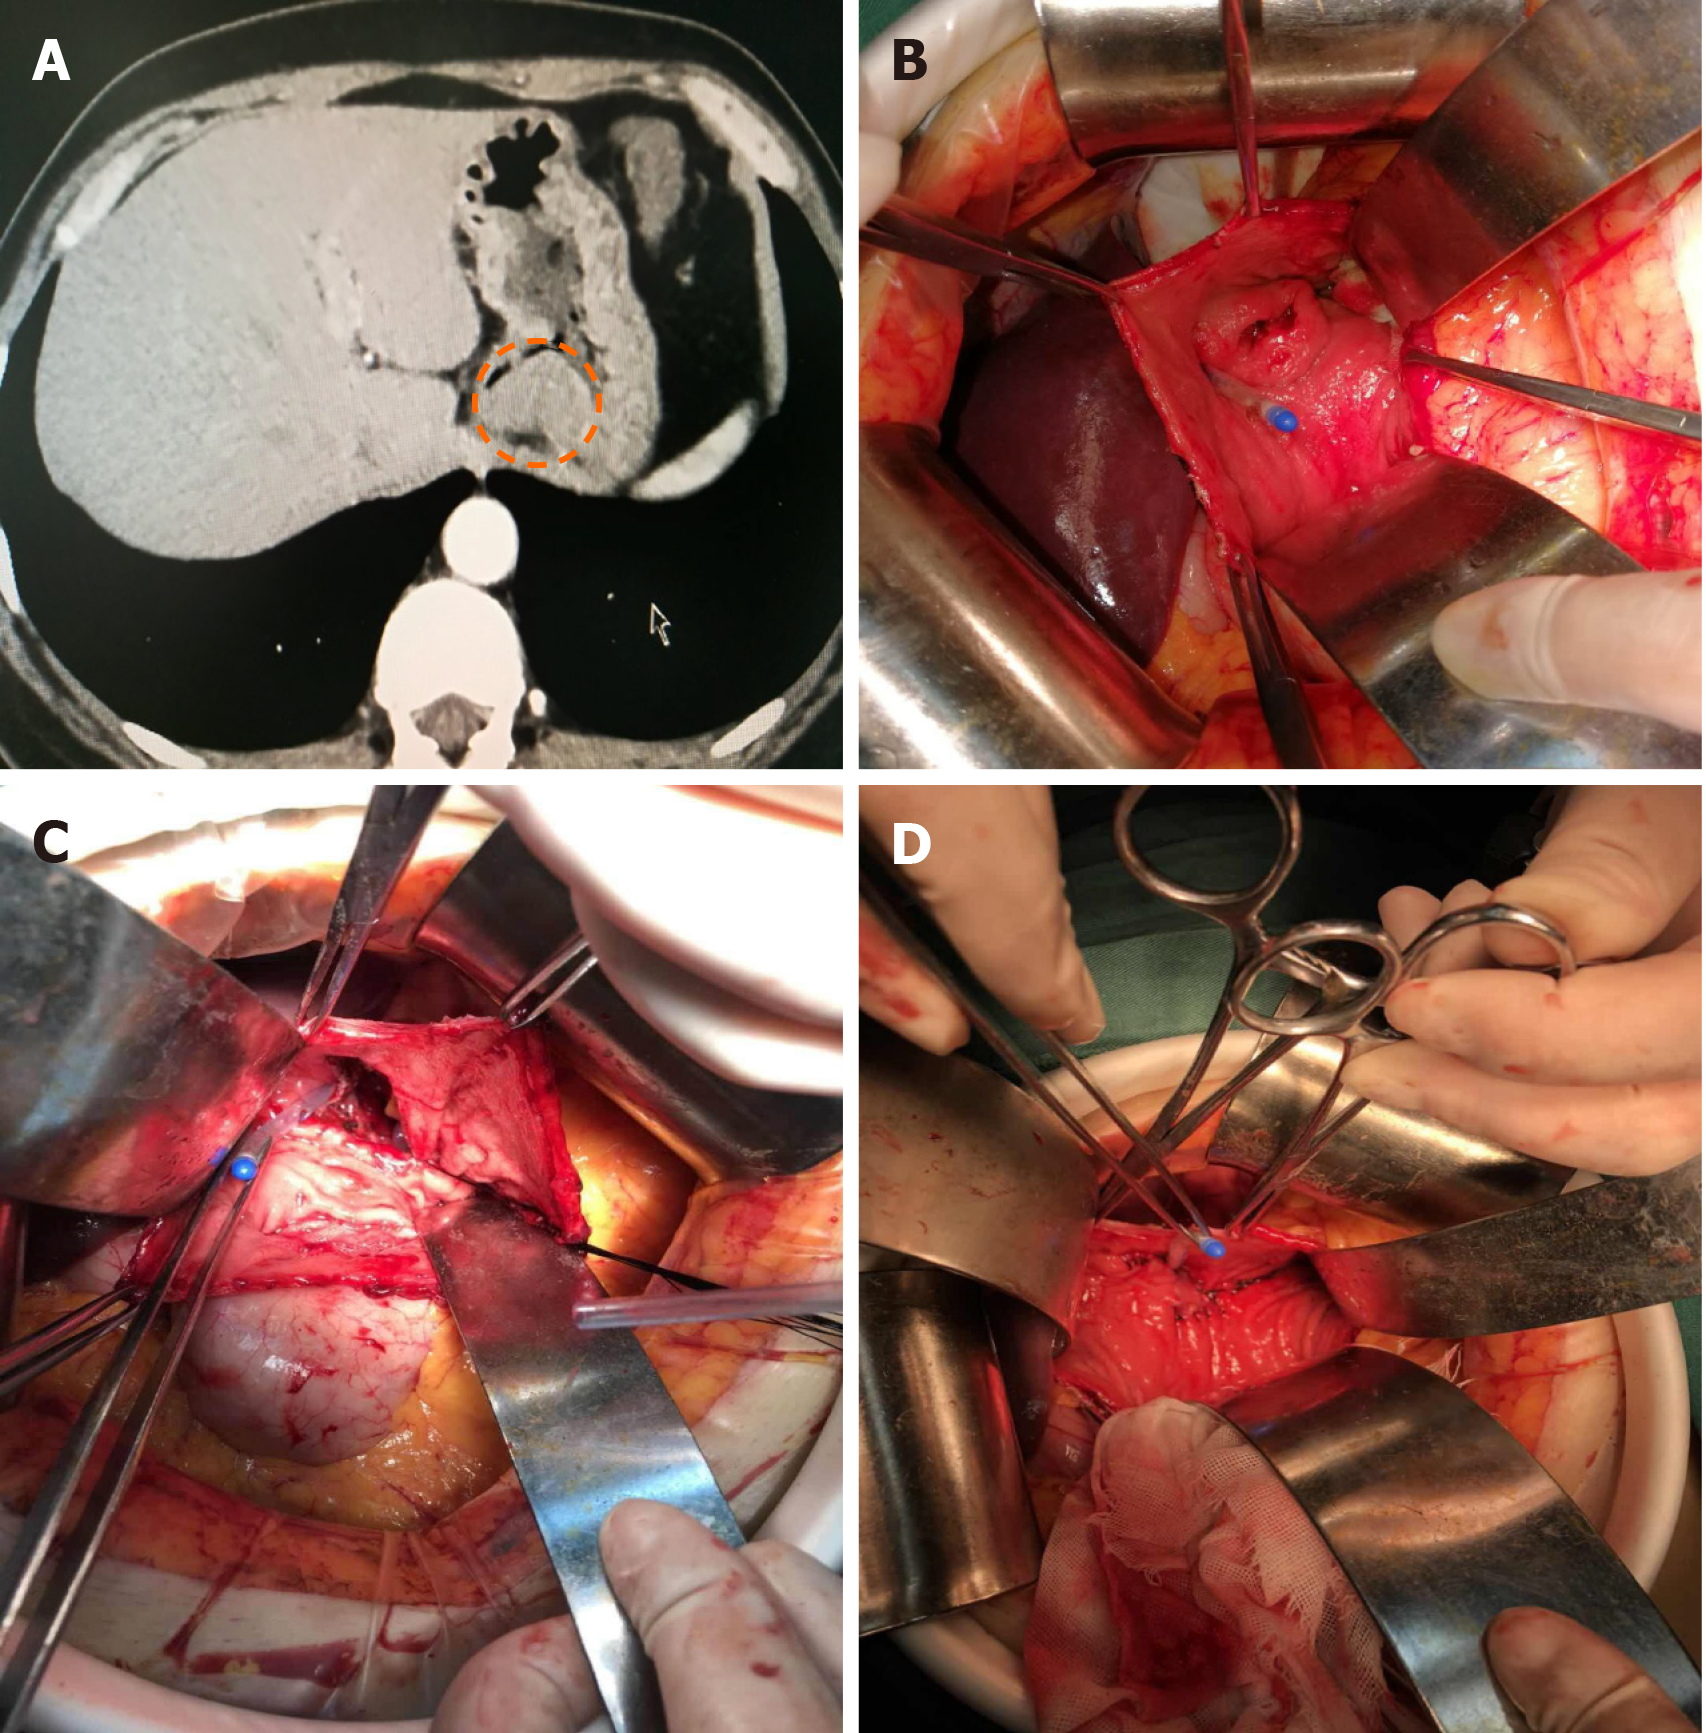
Figure 3 Conformal resection of type A esophagogastric junction-gastrointestinal stromal tumor located in the posterior wall of esophagogastric junction.
A: The abdominal computed tomography showing the lesion located in posterior wall of the esophagogastric junction; B: Anterior gastrotomy to visualize the lesion; C: Removal of the tumor; D: Suturing of the posterior wall of the esophagus to the gastric wall.
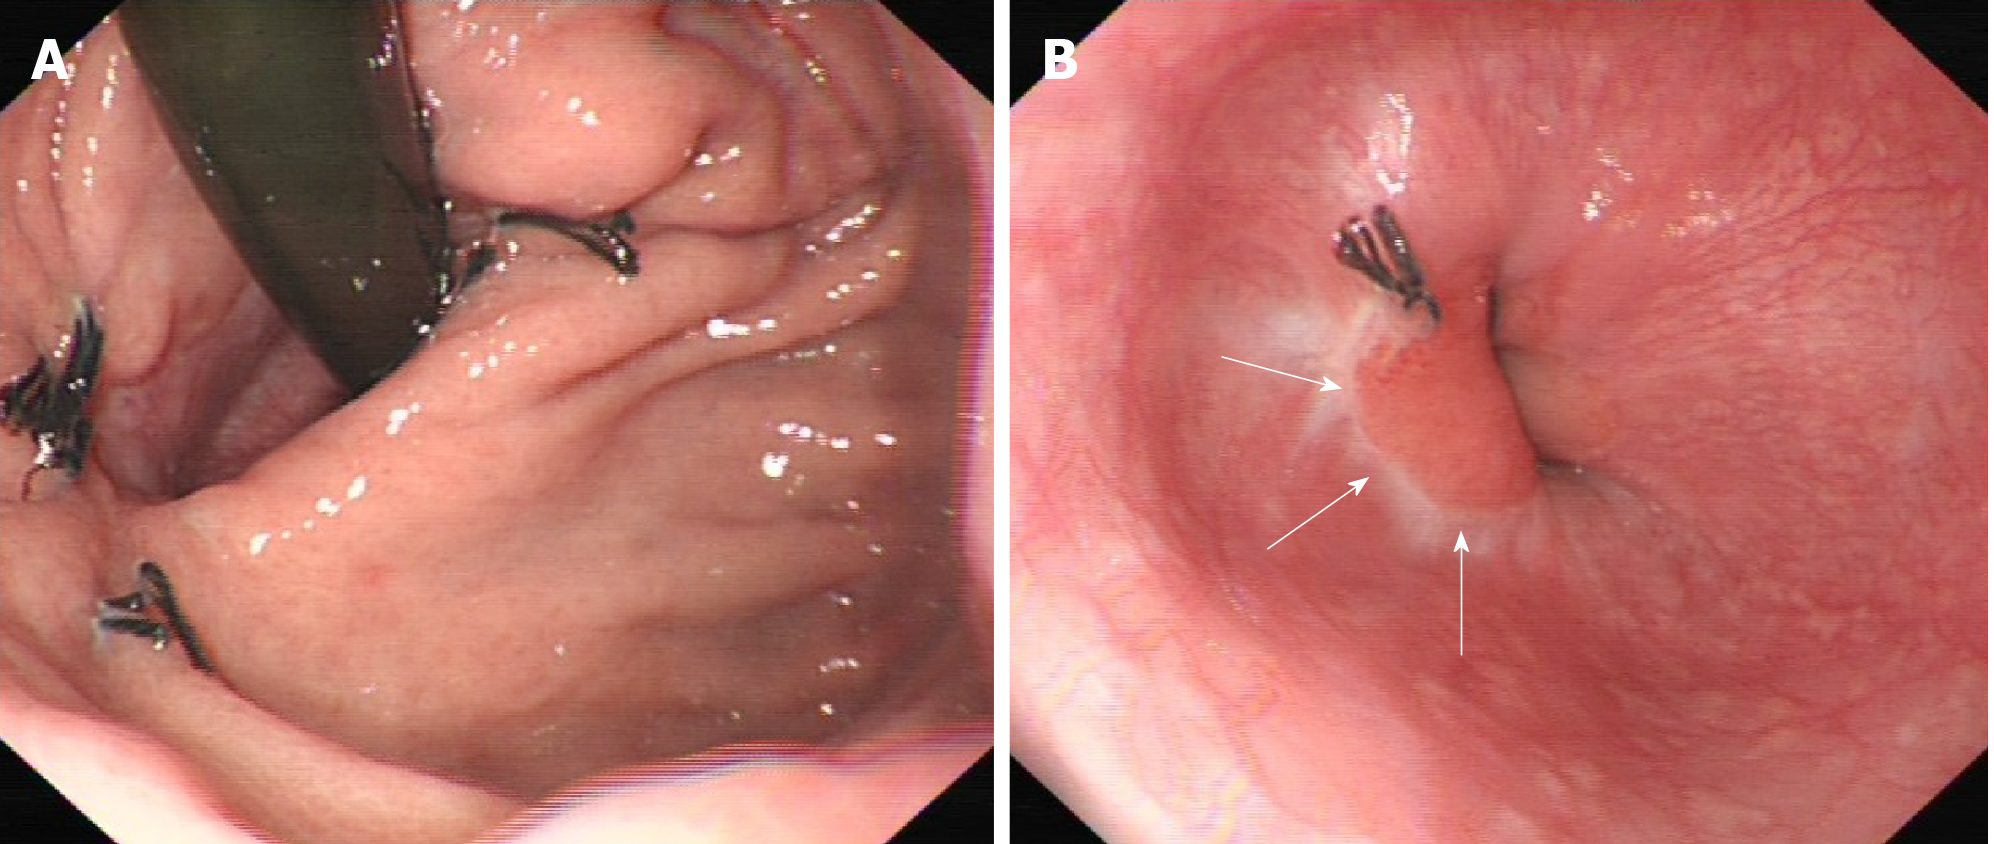
Figure 4 Gastroduodenal endoscopy 2 mo after the operation.
A: Gastric view; B: Esophageal view.
Figure 5 The receiver operating characteristic curve analyses showed that the best cut-off value of distance of involving Z-line was 7.
0 mm.
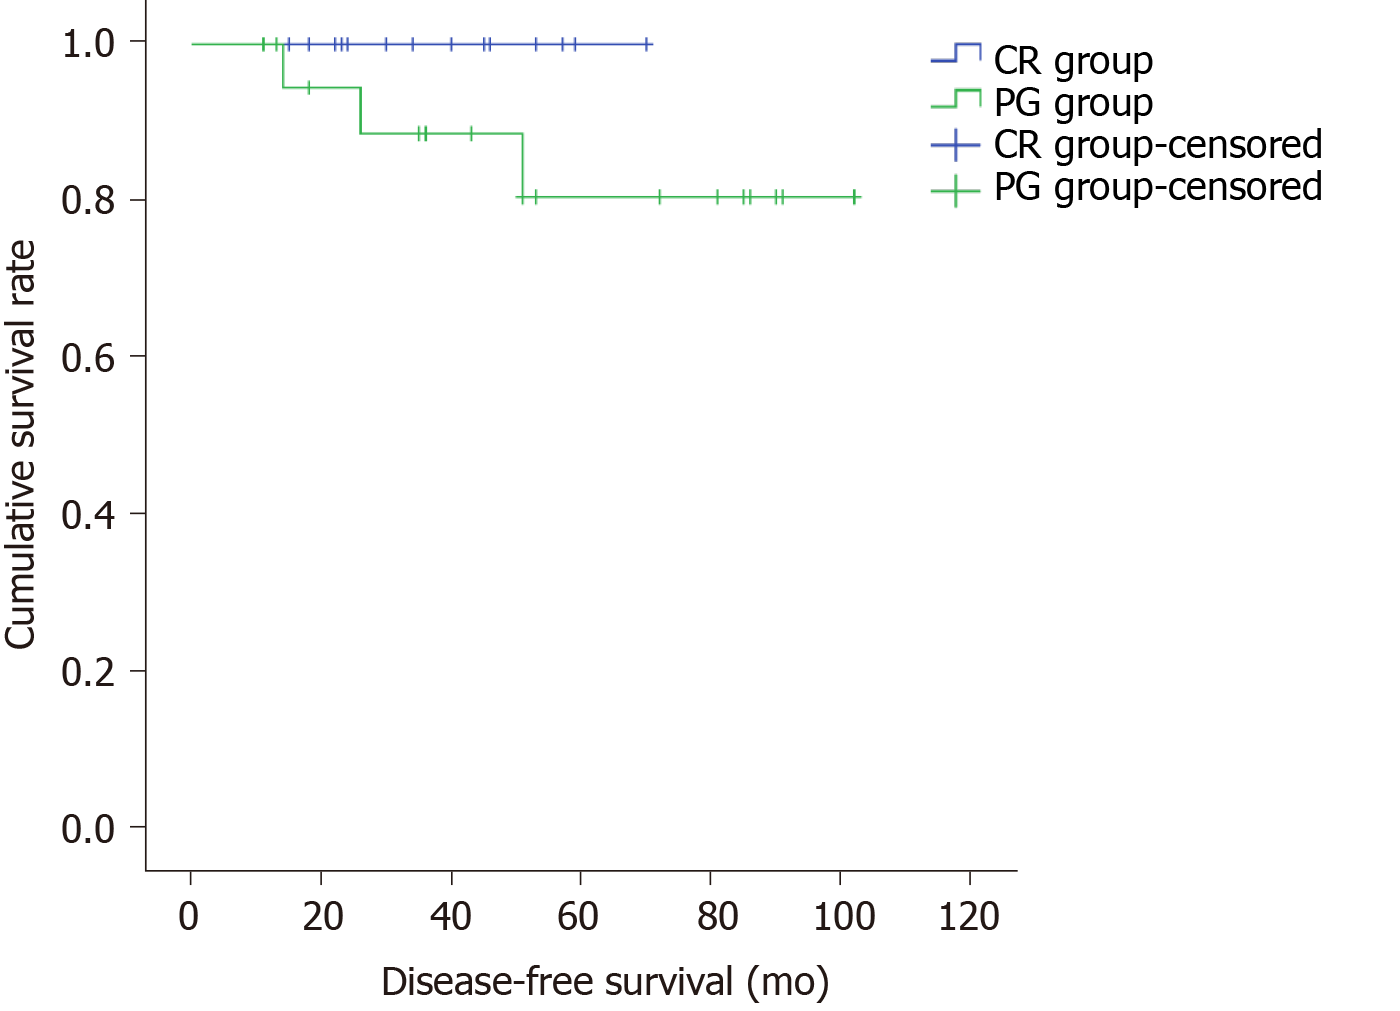
Figure 6 The disease-free survival between conformal resection group and proximal gastrectomy group (P = 0.
163). CR: Conformal resection; PG: Proximal gastrectomy.
- Citation: Zheng GL, Zhang B, Wang Y, Liu Y, Zhu HT, Zhao Y, Zheng ZC. Surgical resection of esophagogastric junction stromal tumor: How to protect the cardiac function. World J Gastroenterol 2021; 27(9): 854-865
- URL: https://www.wjgnet.com/1007-9327/full/v27/i9/854.htm
- DOI: https://dx.doi.org/10.3748/wjg.v27.i9.854


