Copyright
©The Author(s) 2021.
World J Gastroenterol. Feb 28, 2021; 27(8): 737-750
Published online Feb 28, 2021. doi: 10.3748/wjg.v27.i8.737
Published online Feb 28, 2021. doi: 10.3748/wjg.v27.i8.737
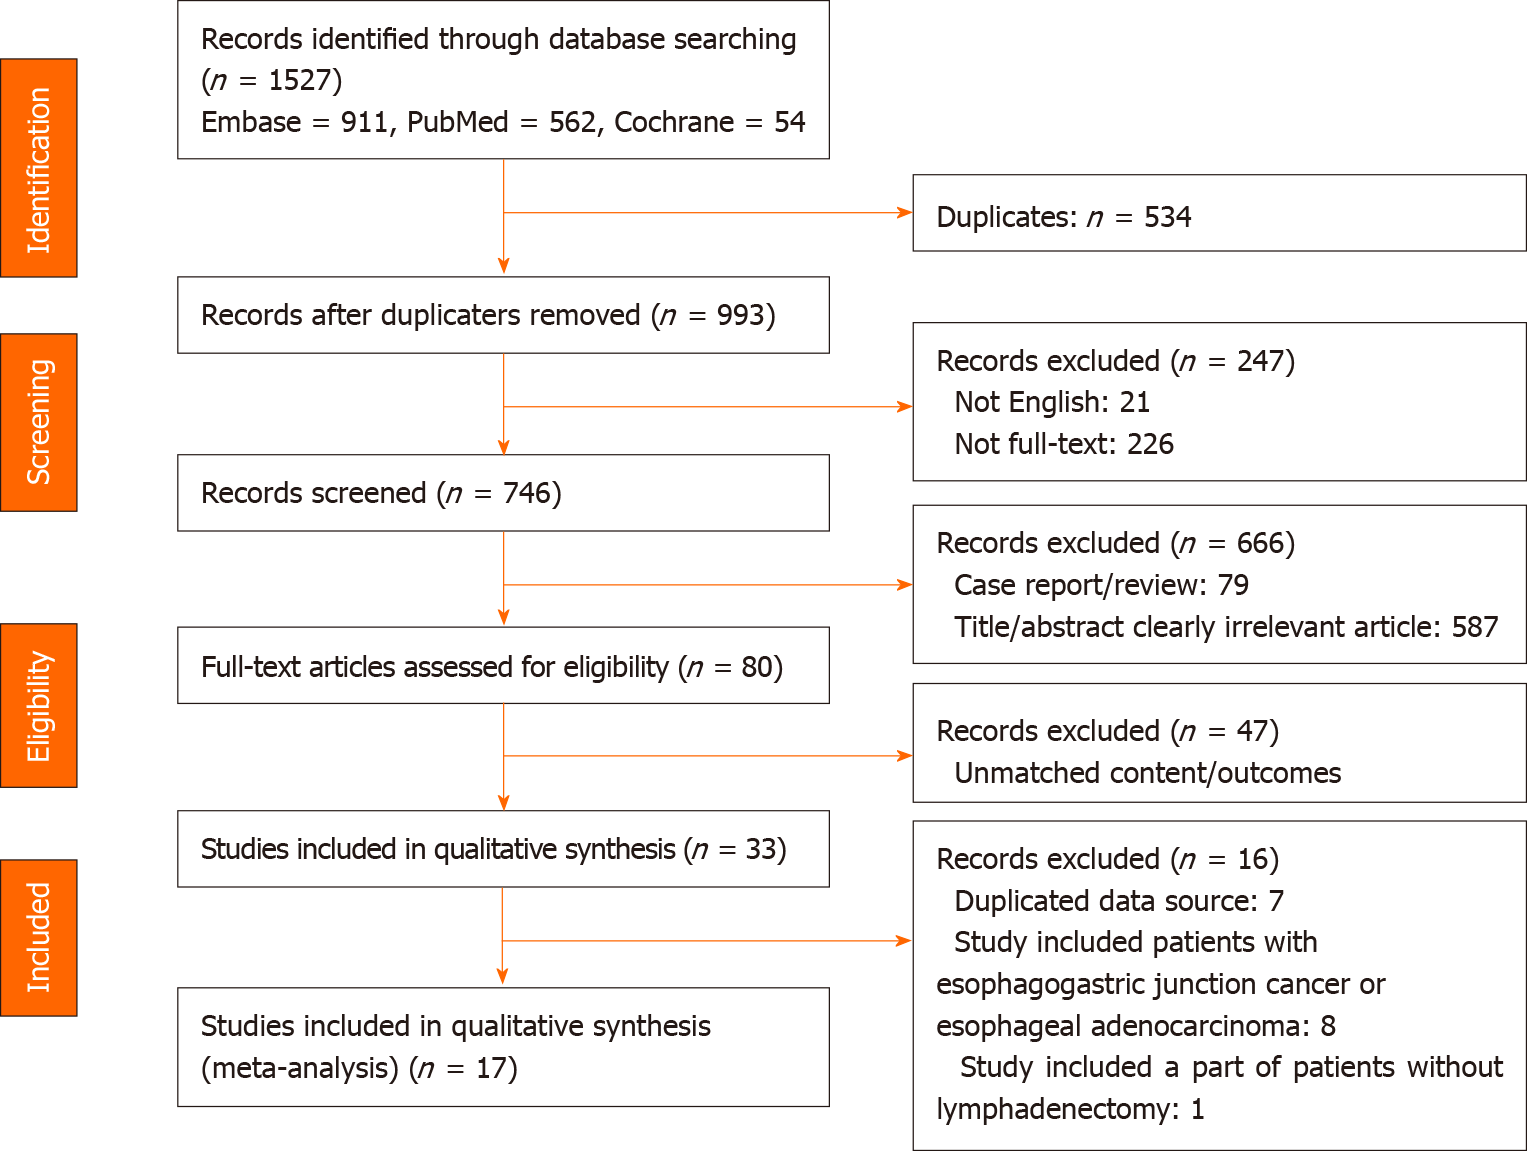
Figure 1 The flow chart of the selection process for the studies included in this meta-analysis.
In total, 1527 records were identified from all sources (Embase, PubMed, and Cochrane Library). Only 17 studies involving 3775 patients met all inclusion criteria and were selected for the meta-analysis.
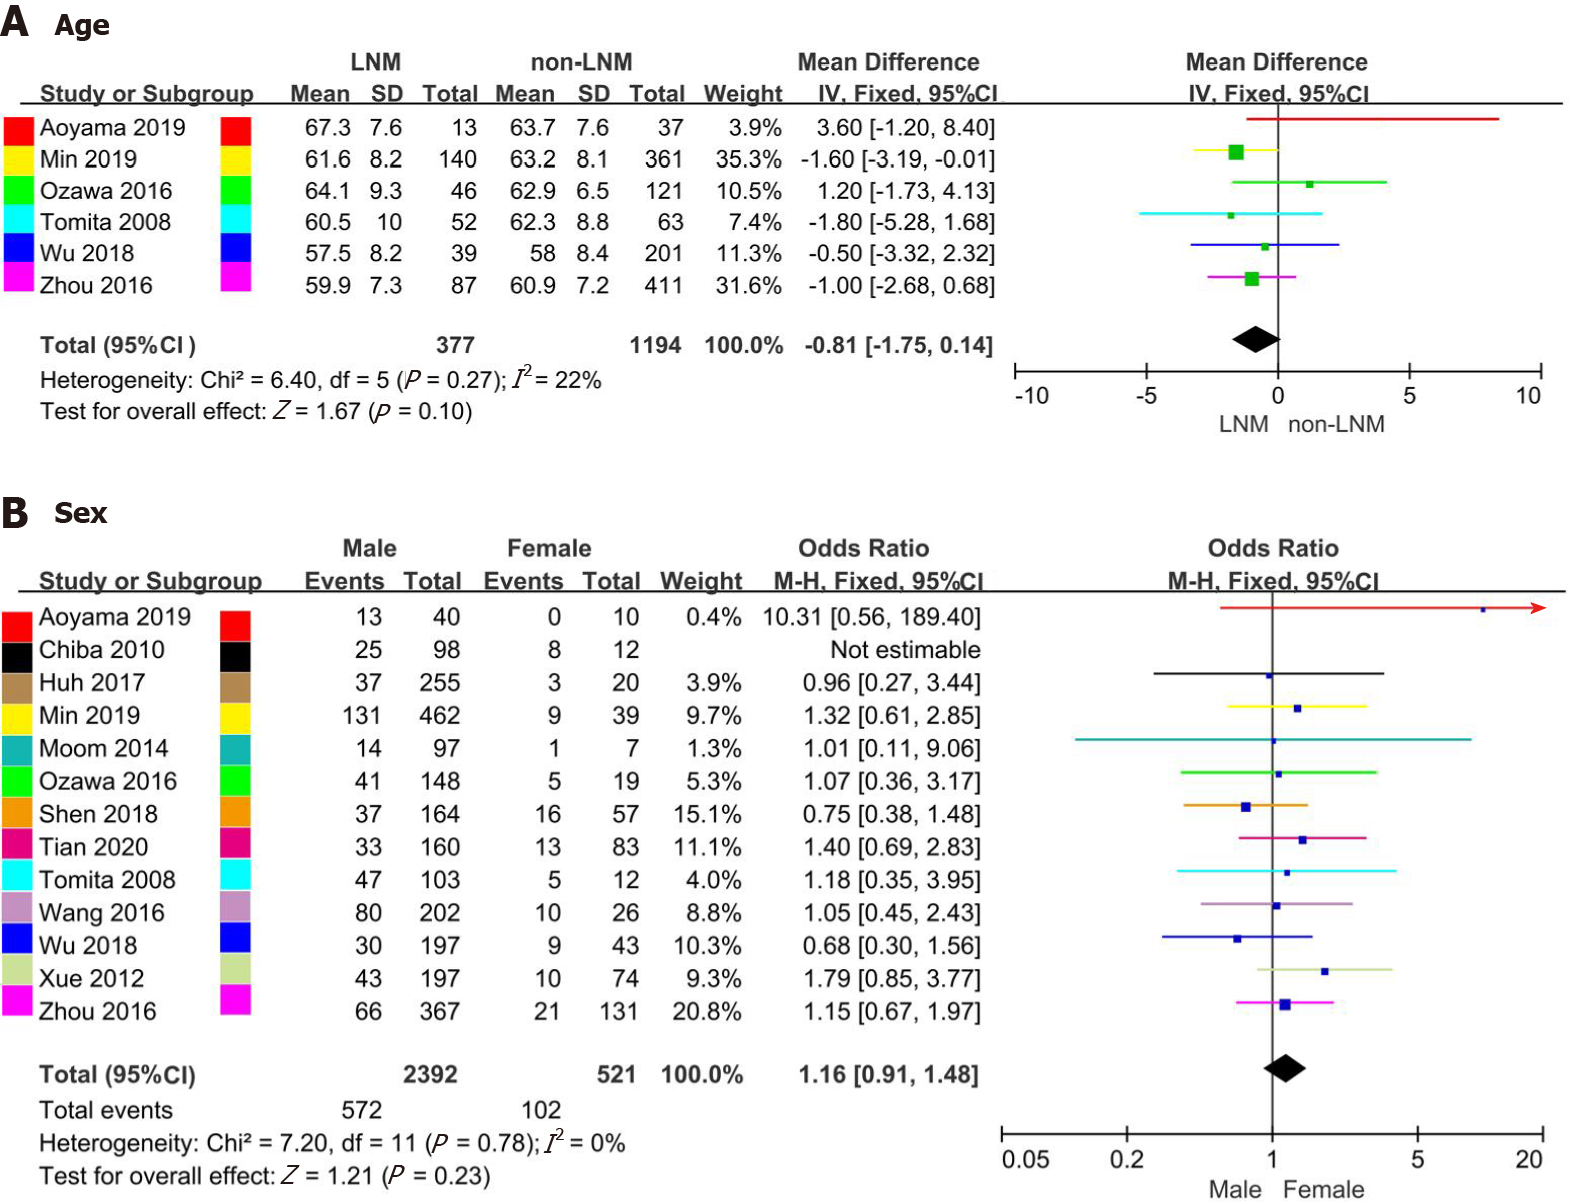
Figure 2 Forest plot.
A: Forest plot evaluating the association between age (> 60/≤ 60) and lymph node metastasis (LNM); B: Forest plot evaluating the association between sex (male/female) and LNM. CI: Confidence interval; IV: Inverse-Variance; M-H: Mantel-Haenszel.
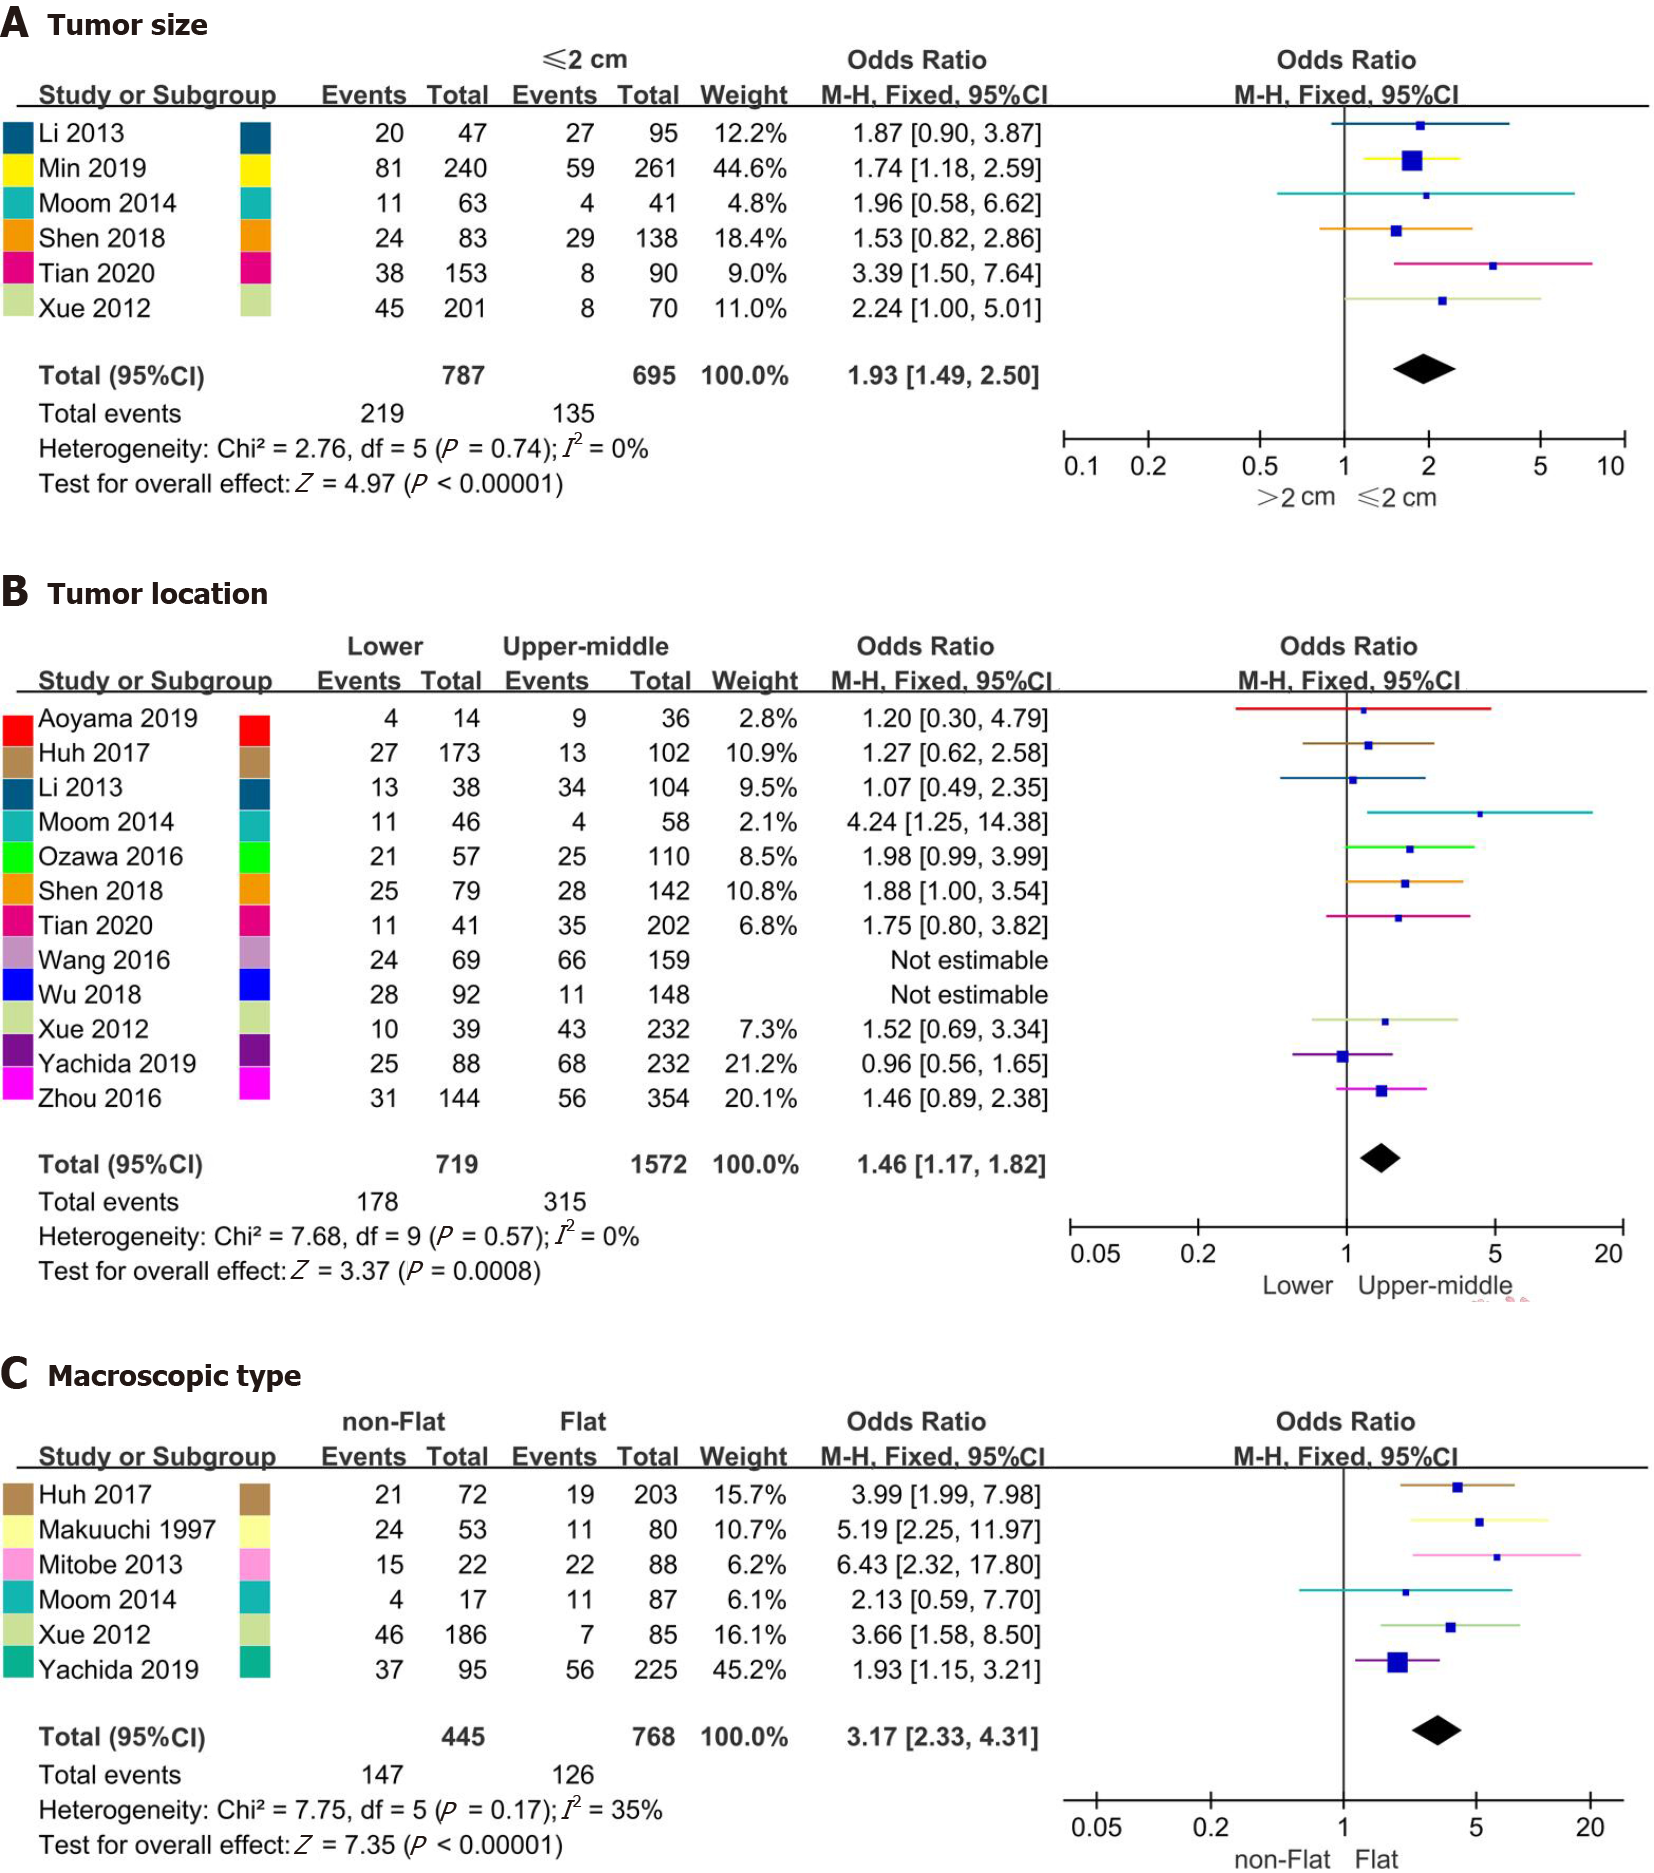
Figure 3 Forest plot.
A: Forest plot evaluating the association between tumor size (> 2/≤ 2) and lymph node metastasis (LNM); B: Forest plot evaluating the association between tumor location (lower/upper-middle) and LNM; C: Forest plot evaluating the association between macroscopic type (nonflat/flat) and LNM. CI: Confidence interval; M-H: Mantel-Haenszel.
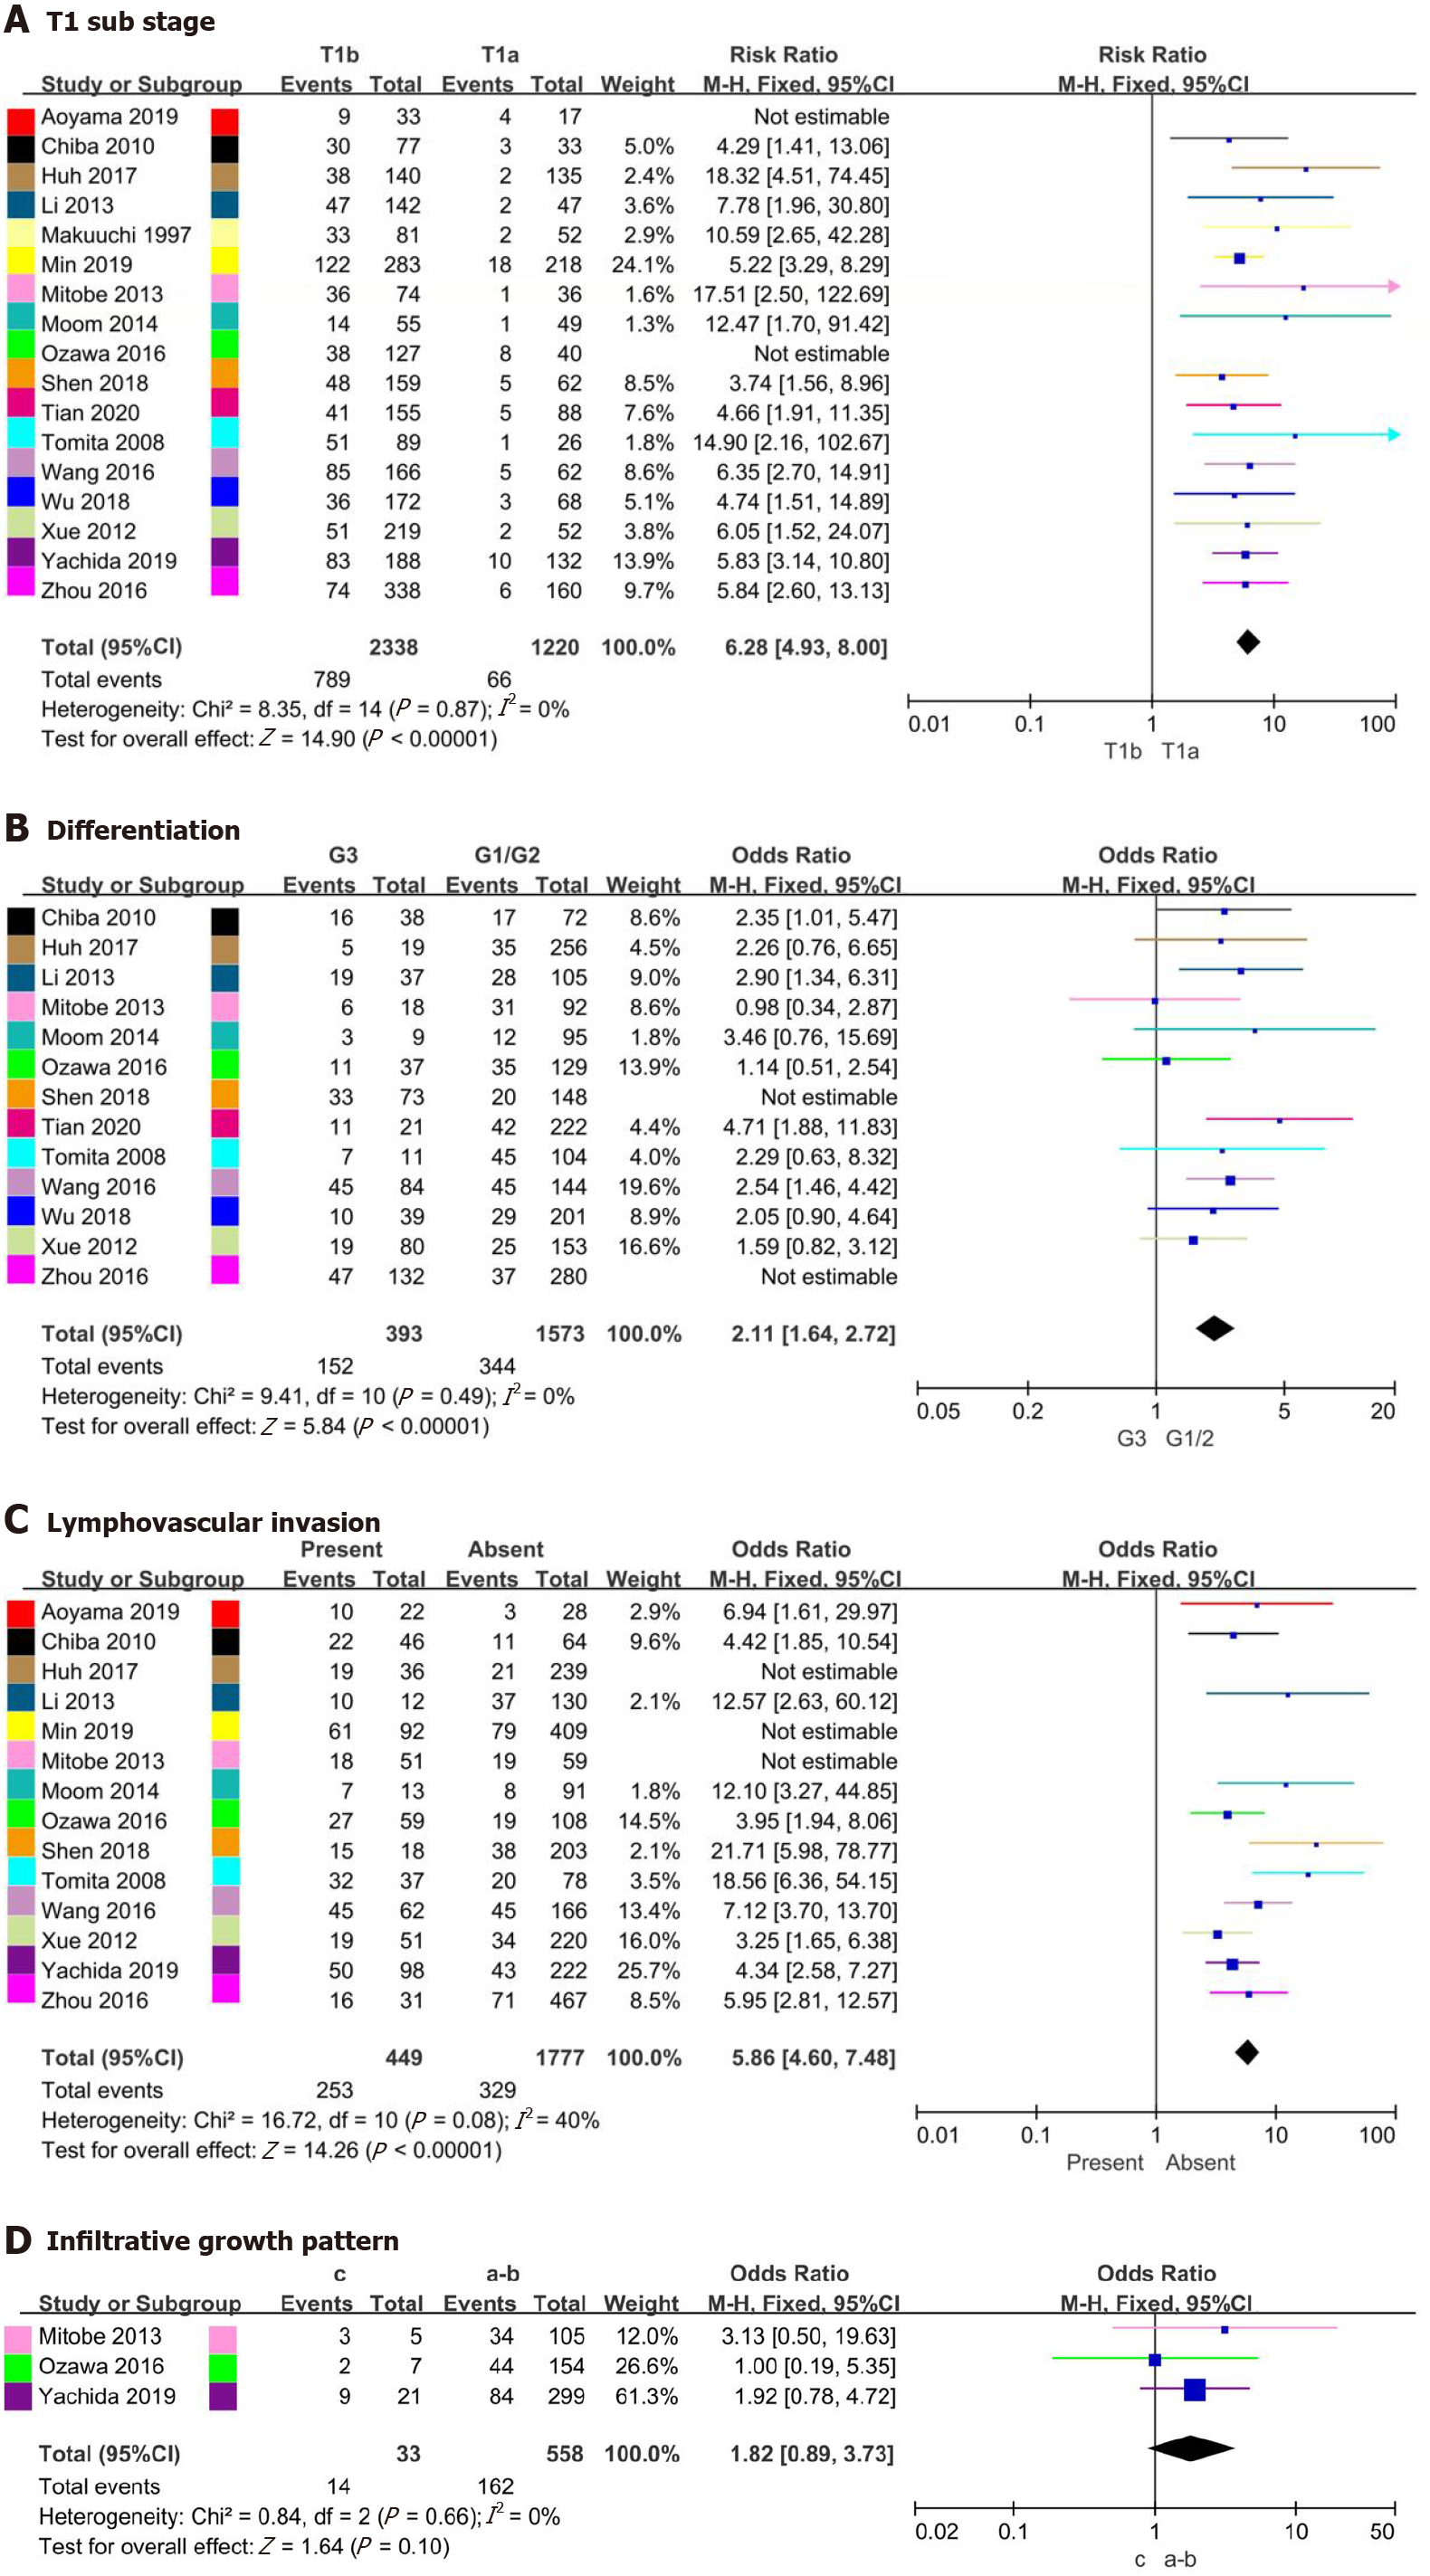
Figure 4 Forest plot.
A: Forest plot evaluating the association between T1 substage (T1a/T1b) and lymph node metastasis (LNM); B: Forest plot evaluating the association between differentiation (poorly differentiated/well differentiated-moderately differentiated) and LNM; C: Forest plot evaluating the association between lymphovascular invasion (present/absent) and LNM; D: Forest plot evaluating the association between infiltrative growth pattern (c/a-b) and LNM. CI: Confidence interval; G1/2: Well differentiated/moderately differentiated; G3: Poorly differentiated; M-H: Mantel-Haenszel.
- Citation: Jiang KY, Huang H, Chen WY, Yan HJ, Wei ZT, Wang XW, Li HX, Zheng XY, Tian D. Risk factors for lymph node metastasis in T1 esophageal squamous cell carcinoma: A systematic review and meta-analysis. World J Gastroenterol 2021; 27(8): 737-750
- URL: https://www.wjgnet.com/1007-9327/full/v27/i8/737.htm
- DOI: https://dx.doi.org/10.3748/wjg.v27.i8.737


