Copyright
©The Author(s) 2021.
World J Gastroenterol. Nov 14, 2021; 27(42): 7311-7323
Published online Nov 14, 2021. doi: 10.3748/wjg.v27.i42.7311
Published online Nov 14, 2021. doi: 10.3748/wjg.v27.i42.7311
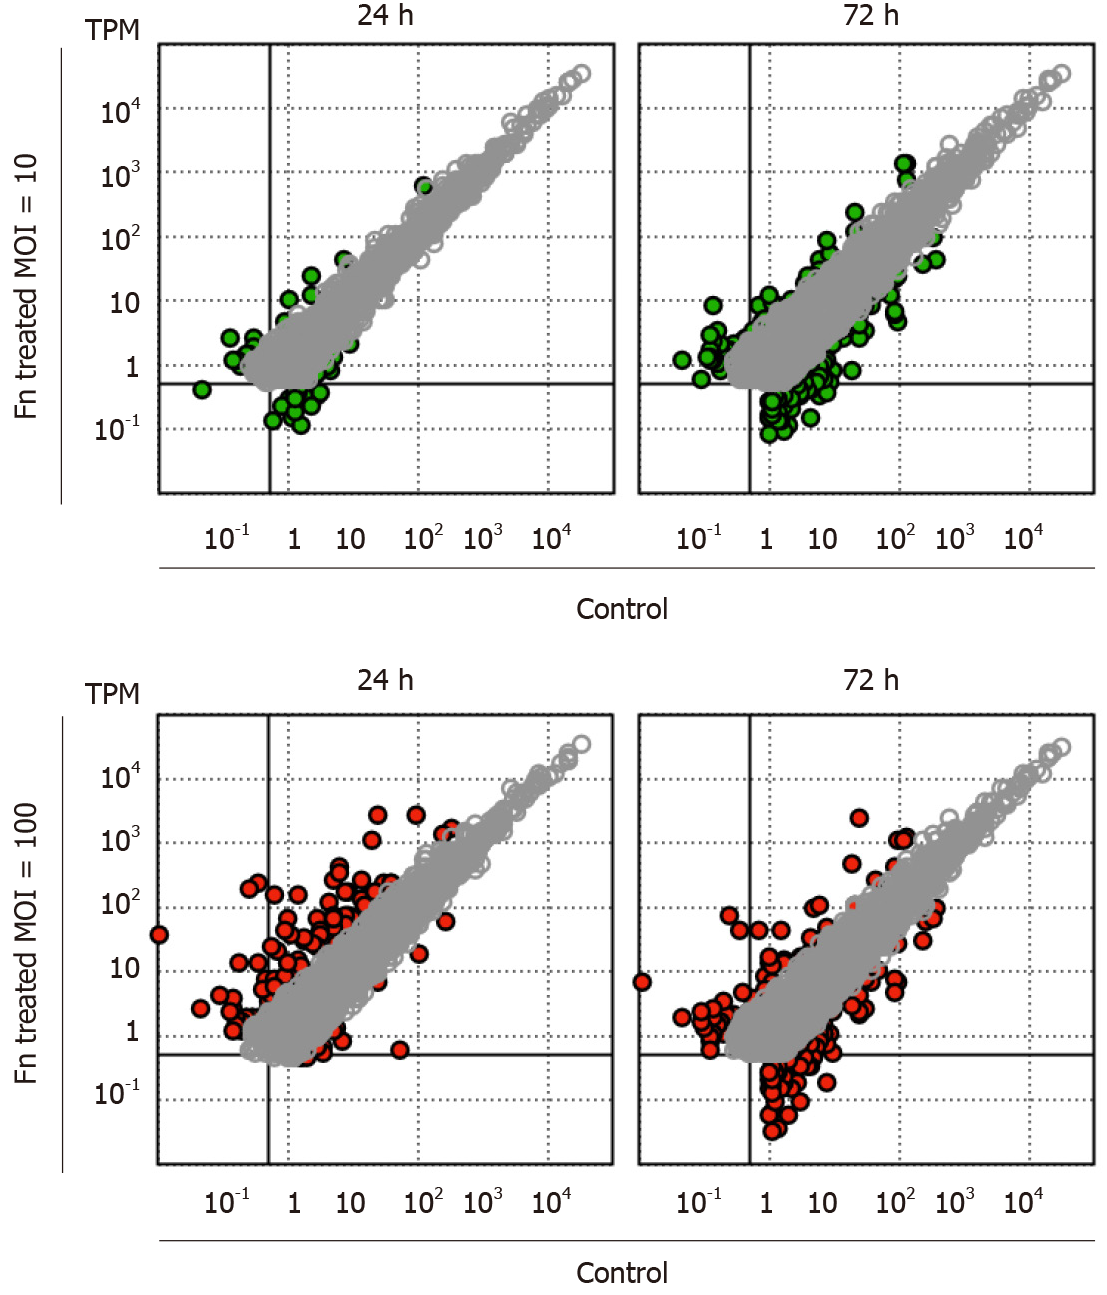
Figure 1 Changes in the gene expression profile of 008L-C2 cancer cells cocultured with Fusobacterium nucleatum.
Fusobacterium nucleatum was added to the cell culture at multiplicity of infection (MOI) 10 and 100. After 24 h and 72 h of incubation, the cells were rinsed extensively to remove unattached bacteria. RNA was collected and analyzed using RNA sequencing. The cells collected at time 0 were used as control. Sequencing reads were trimmed and mapped to hg19 using CLC Genomic Workbench v.12.0.3. The colored dots (green for MOI = 10 and red for MOI = 100) are genes showing more than four-fold change at the respective incubation time. Genes with transcripts per million < 1 in all datasets and less than a four-fold change are not shown.
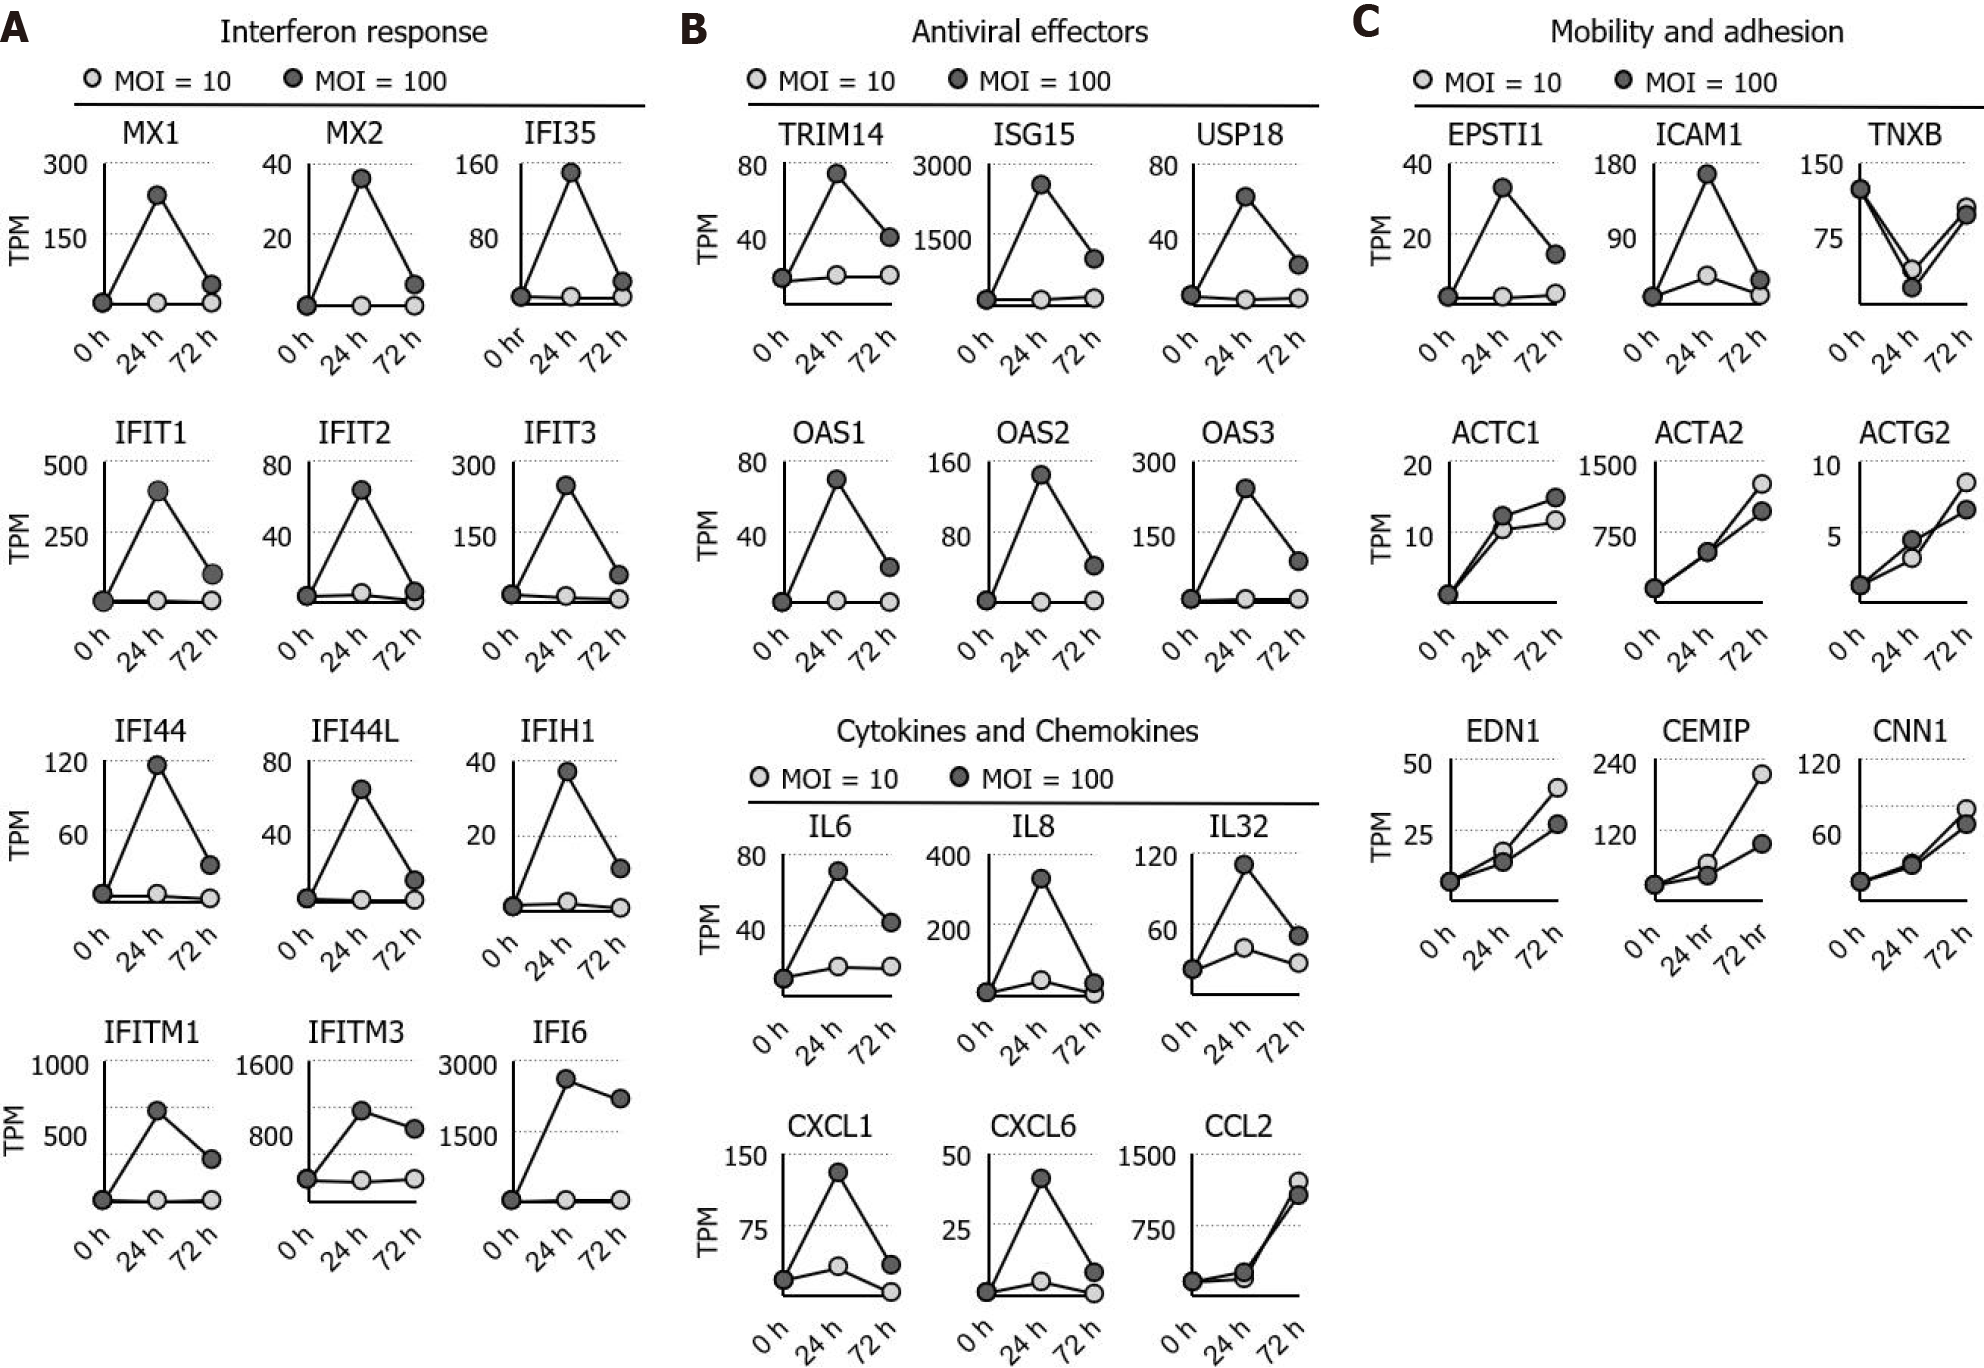
Figure 2 Identification and ontological analysis of the RNA sequencing dataset.
A: The expression dynamics of the interferon response, cytokines, and chemokines genes are shown; B: The expression dynamic of the antiviral genes is shown; C: The expression dynamics of actin, its regulators, and genes involved in cell adhesion are shown. MOI: Multiplicity of infection; TPM: Transcripts per million.
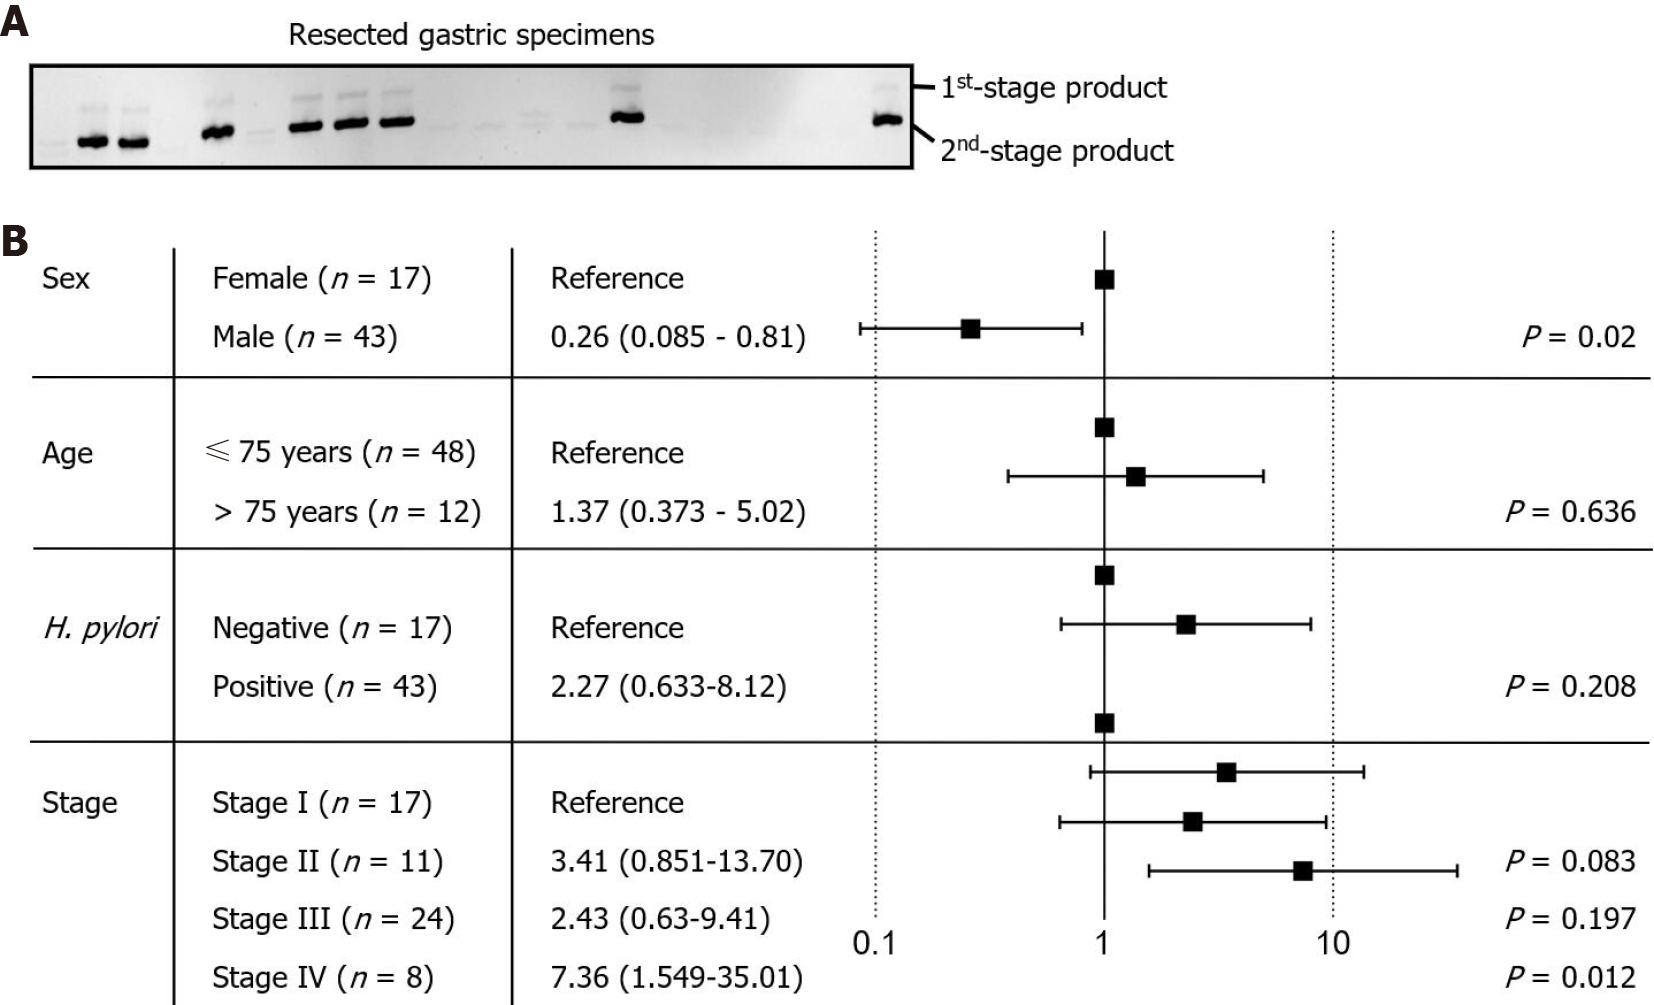
Figure 3 Identification of Fusobacterium nucleatum in the resected gastric cancer tissues.
A: Fusobacterium nucleatum (F. nucleatum) was detected by amplification of the conserved NusG gene sequence using nested polymerase chain reaction method. The end point product was analyzed using 6% nondenaturing polyacrylamide gel electrophoresis; B: The relative risk of F. nucleatum colonization was analyzed against the sex, age, status of Helicobacter pylori colonization, and cancer stage. Data analysis is shown as Forest plot.
Figure 4 Analysis of Fusobacterium nucleatum colonization in gastric cancer patients.
A: The study cohort was divided into Helicobacter pylori (H. pylori)-positive and negative groups according to the result of nested-polymerase chain reaction analysis. Survival probability was calculated using Kaplan-Meier analysis in all or stage II, III, and IV cancer patients with at least 1-year follow-up; B: Survival probability was calculated in stages II, III, and IV cancer patients.
- Citation: Hsieh YY, Tung SY, Pan HY, Chang TS, Wei KL, Chen WM, Deng YF, Lu CK, Lai YH, Wu CS, Li C. Fusobacterium nucleatum colonization is associated with decreased survival of helicobacter pylori-positive gastric cancer patients. World J Gastroenterol 2021; 27(42): 7311-7323
- URL: https://www.wjgnet.com/1007-9327/full/v27/i42/7311.htm
- DOI: https://dx.doi.org/10.3748/wjg.v27.i42.7311


