Copyright
©The Author(s) 2021.
World J Gastroenterol. Oct 21, 2021; 27(39): 6689-6700
Published online Oct 21, 2021. doi: 10.3748/wjg.v27.i39.6689
Published online Oct 21, 2021. doi: 10.3748/wjg.v27.i39.6689
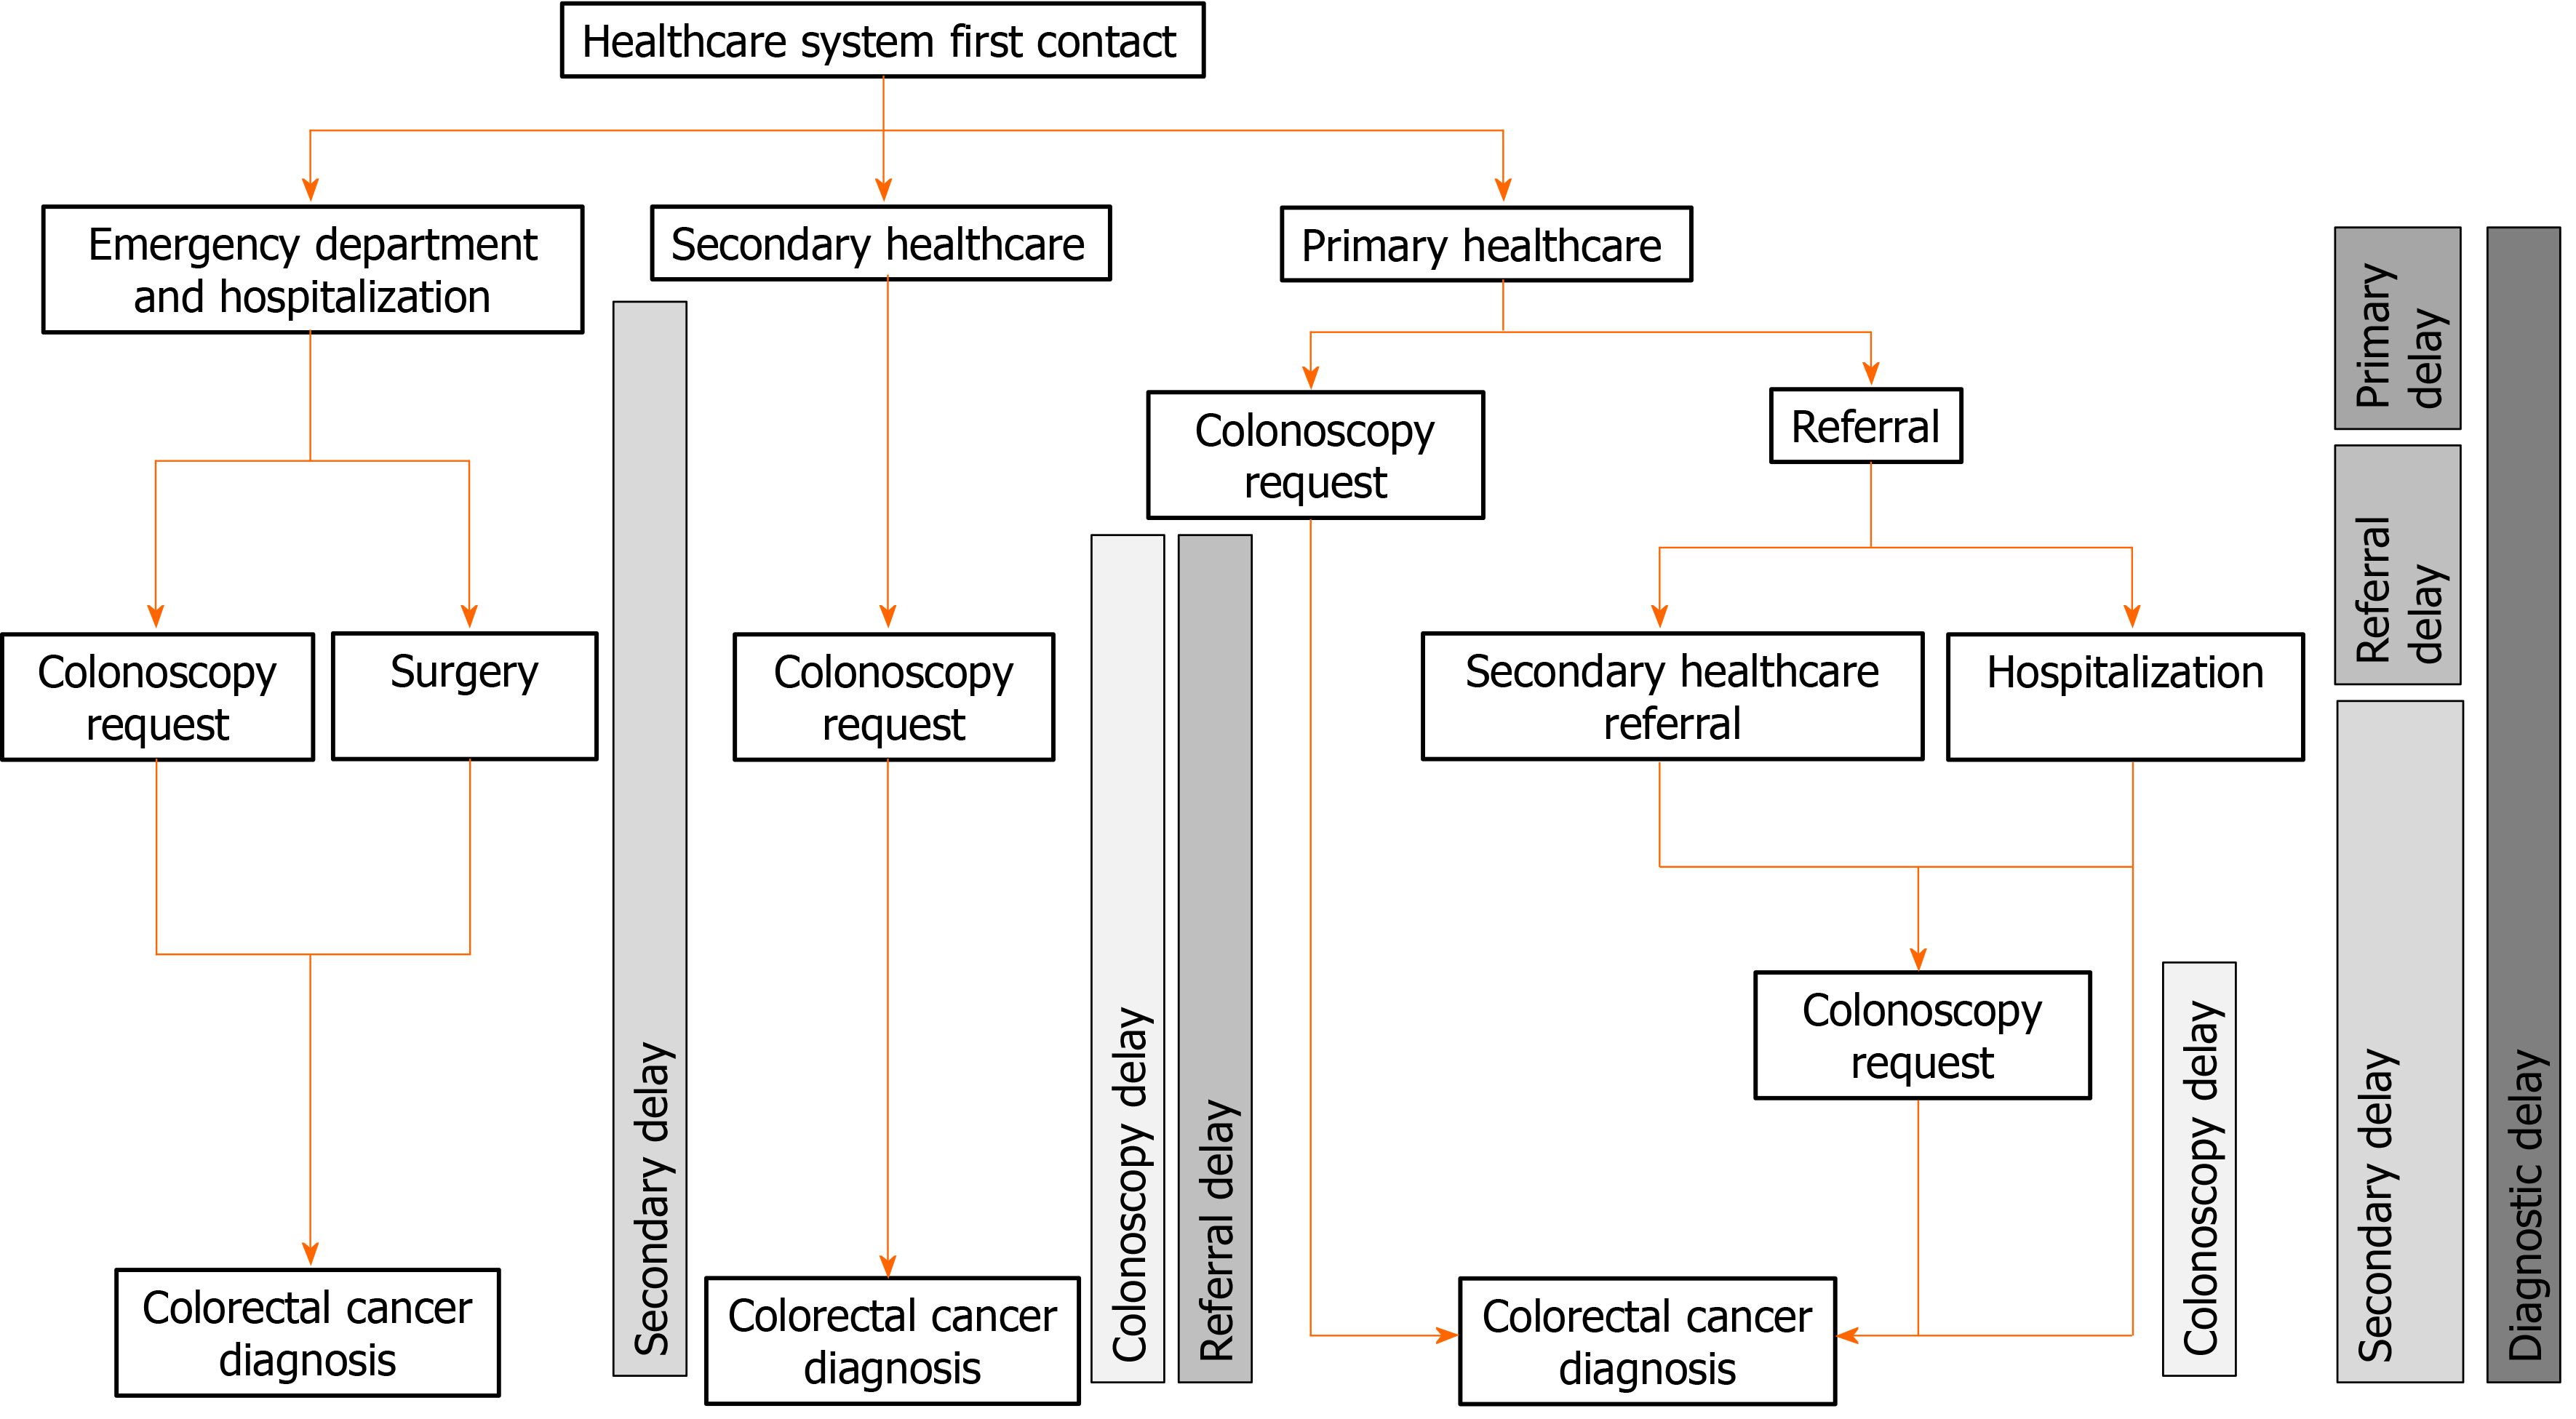
Figure 1 Flowchart of the referral and diagnostic pathways.
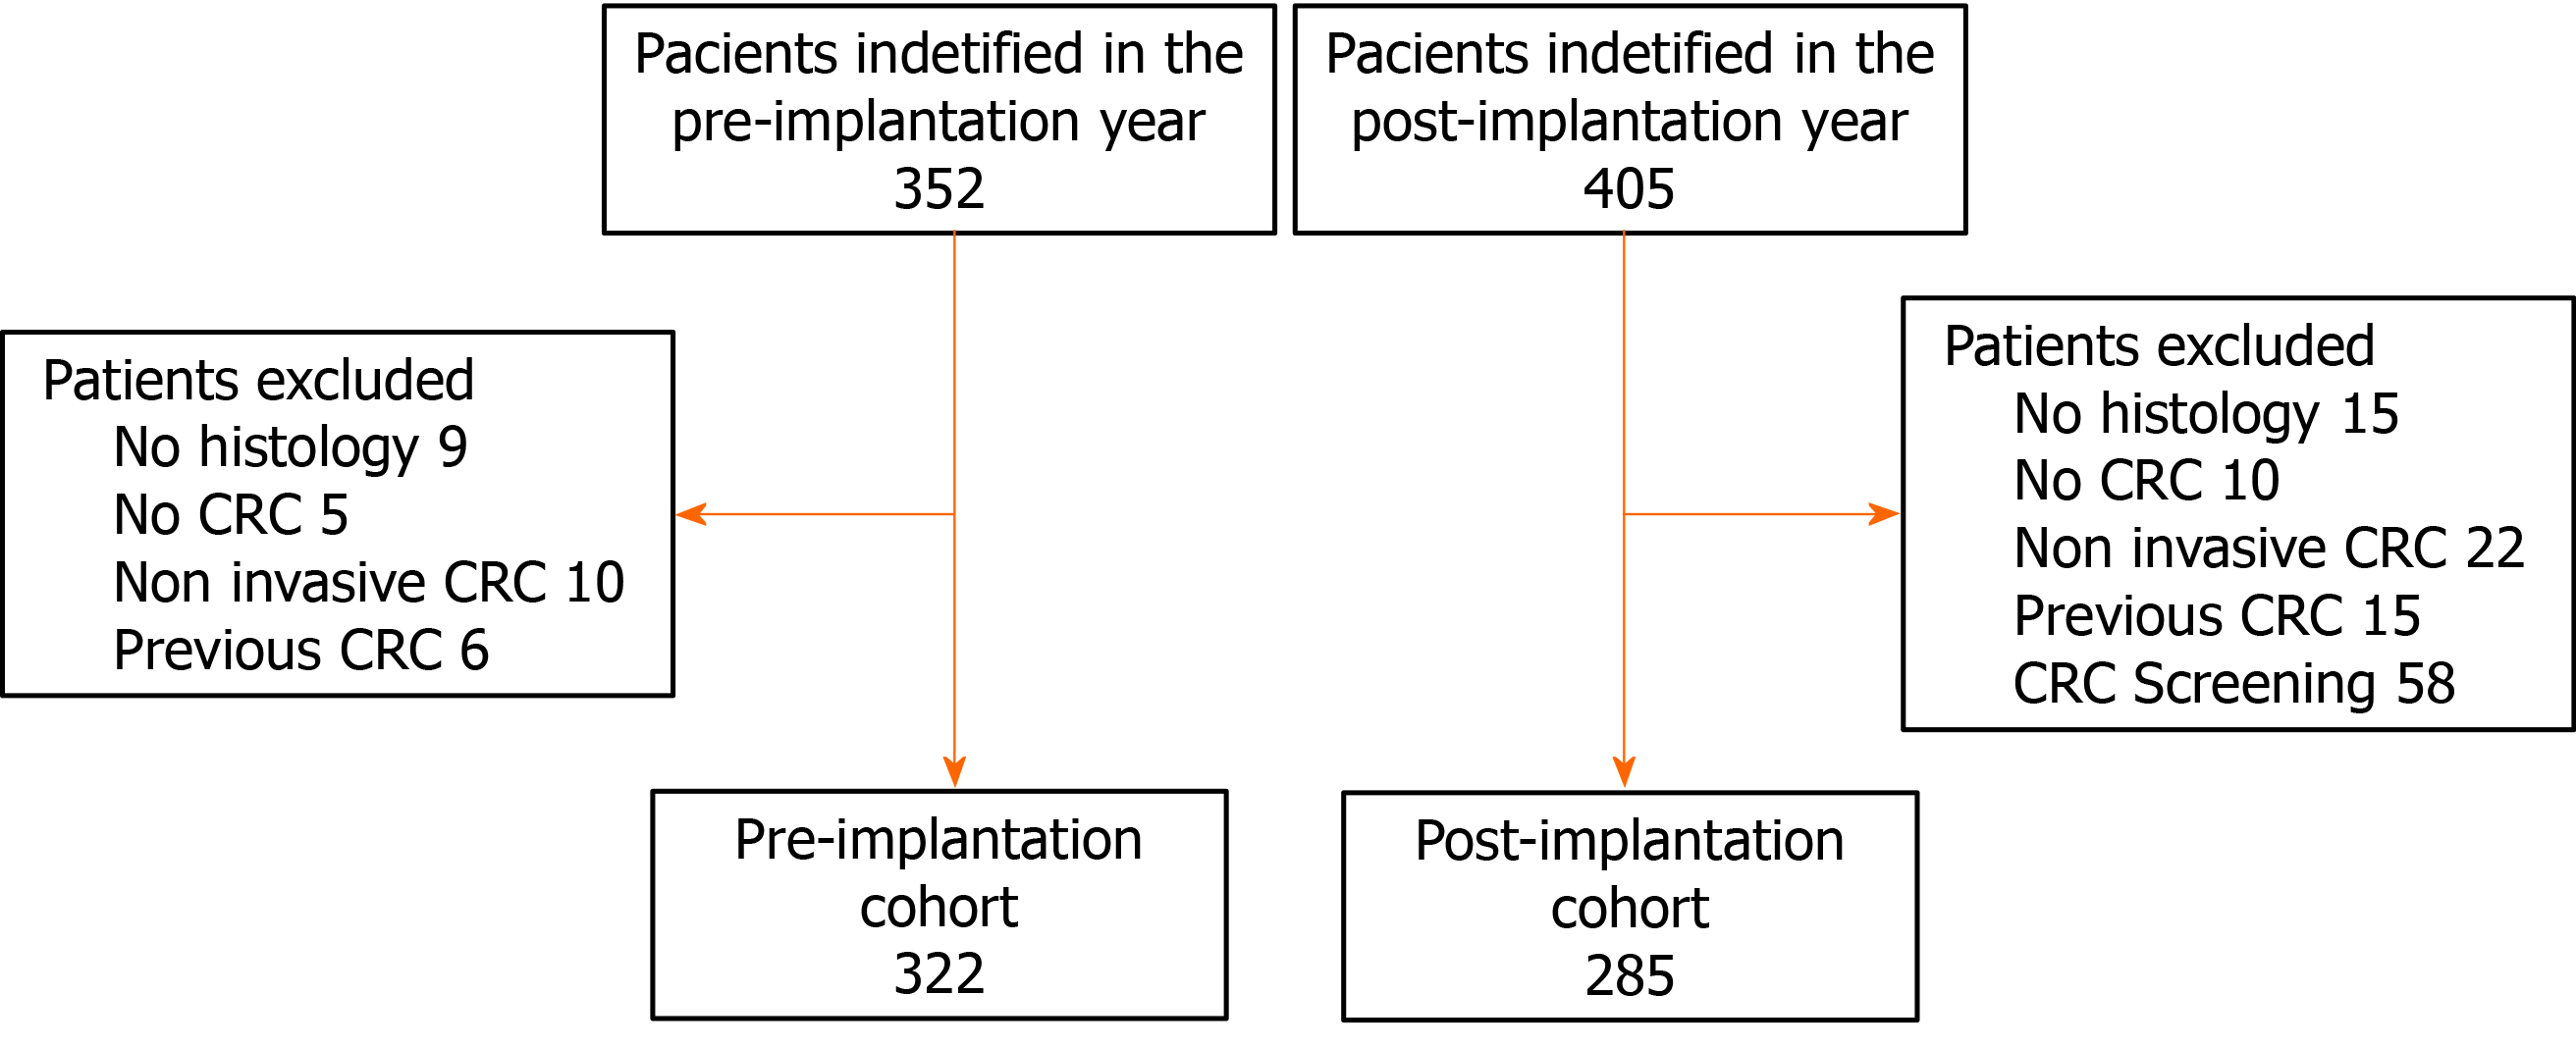
Figure 2 Flowchart of the patients included in the analysis.
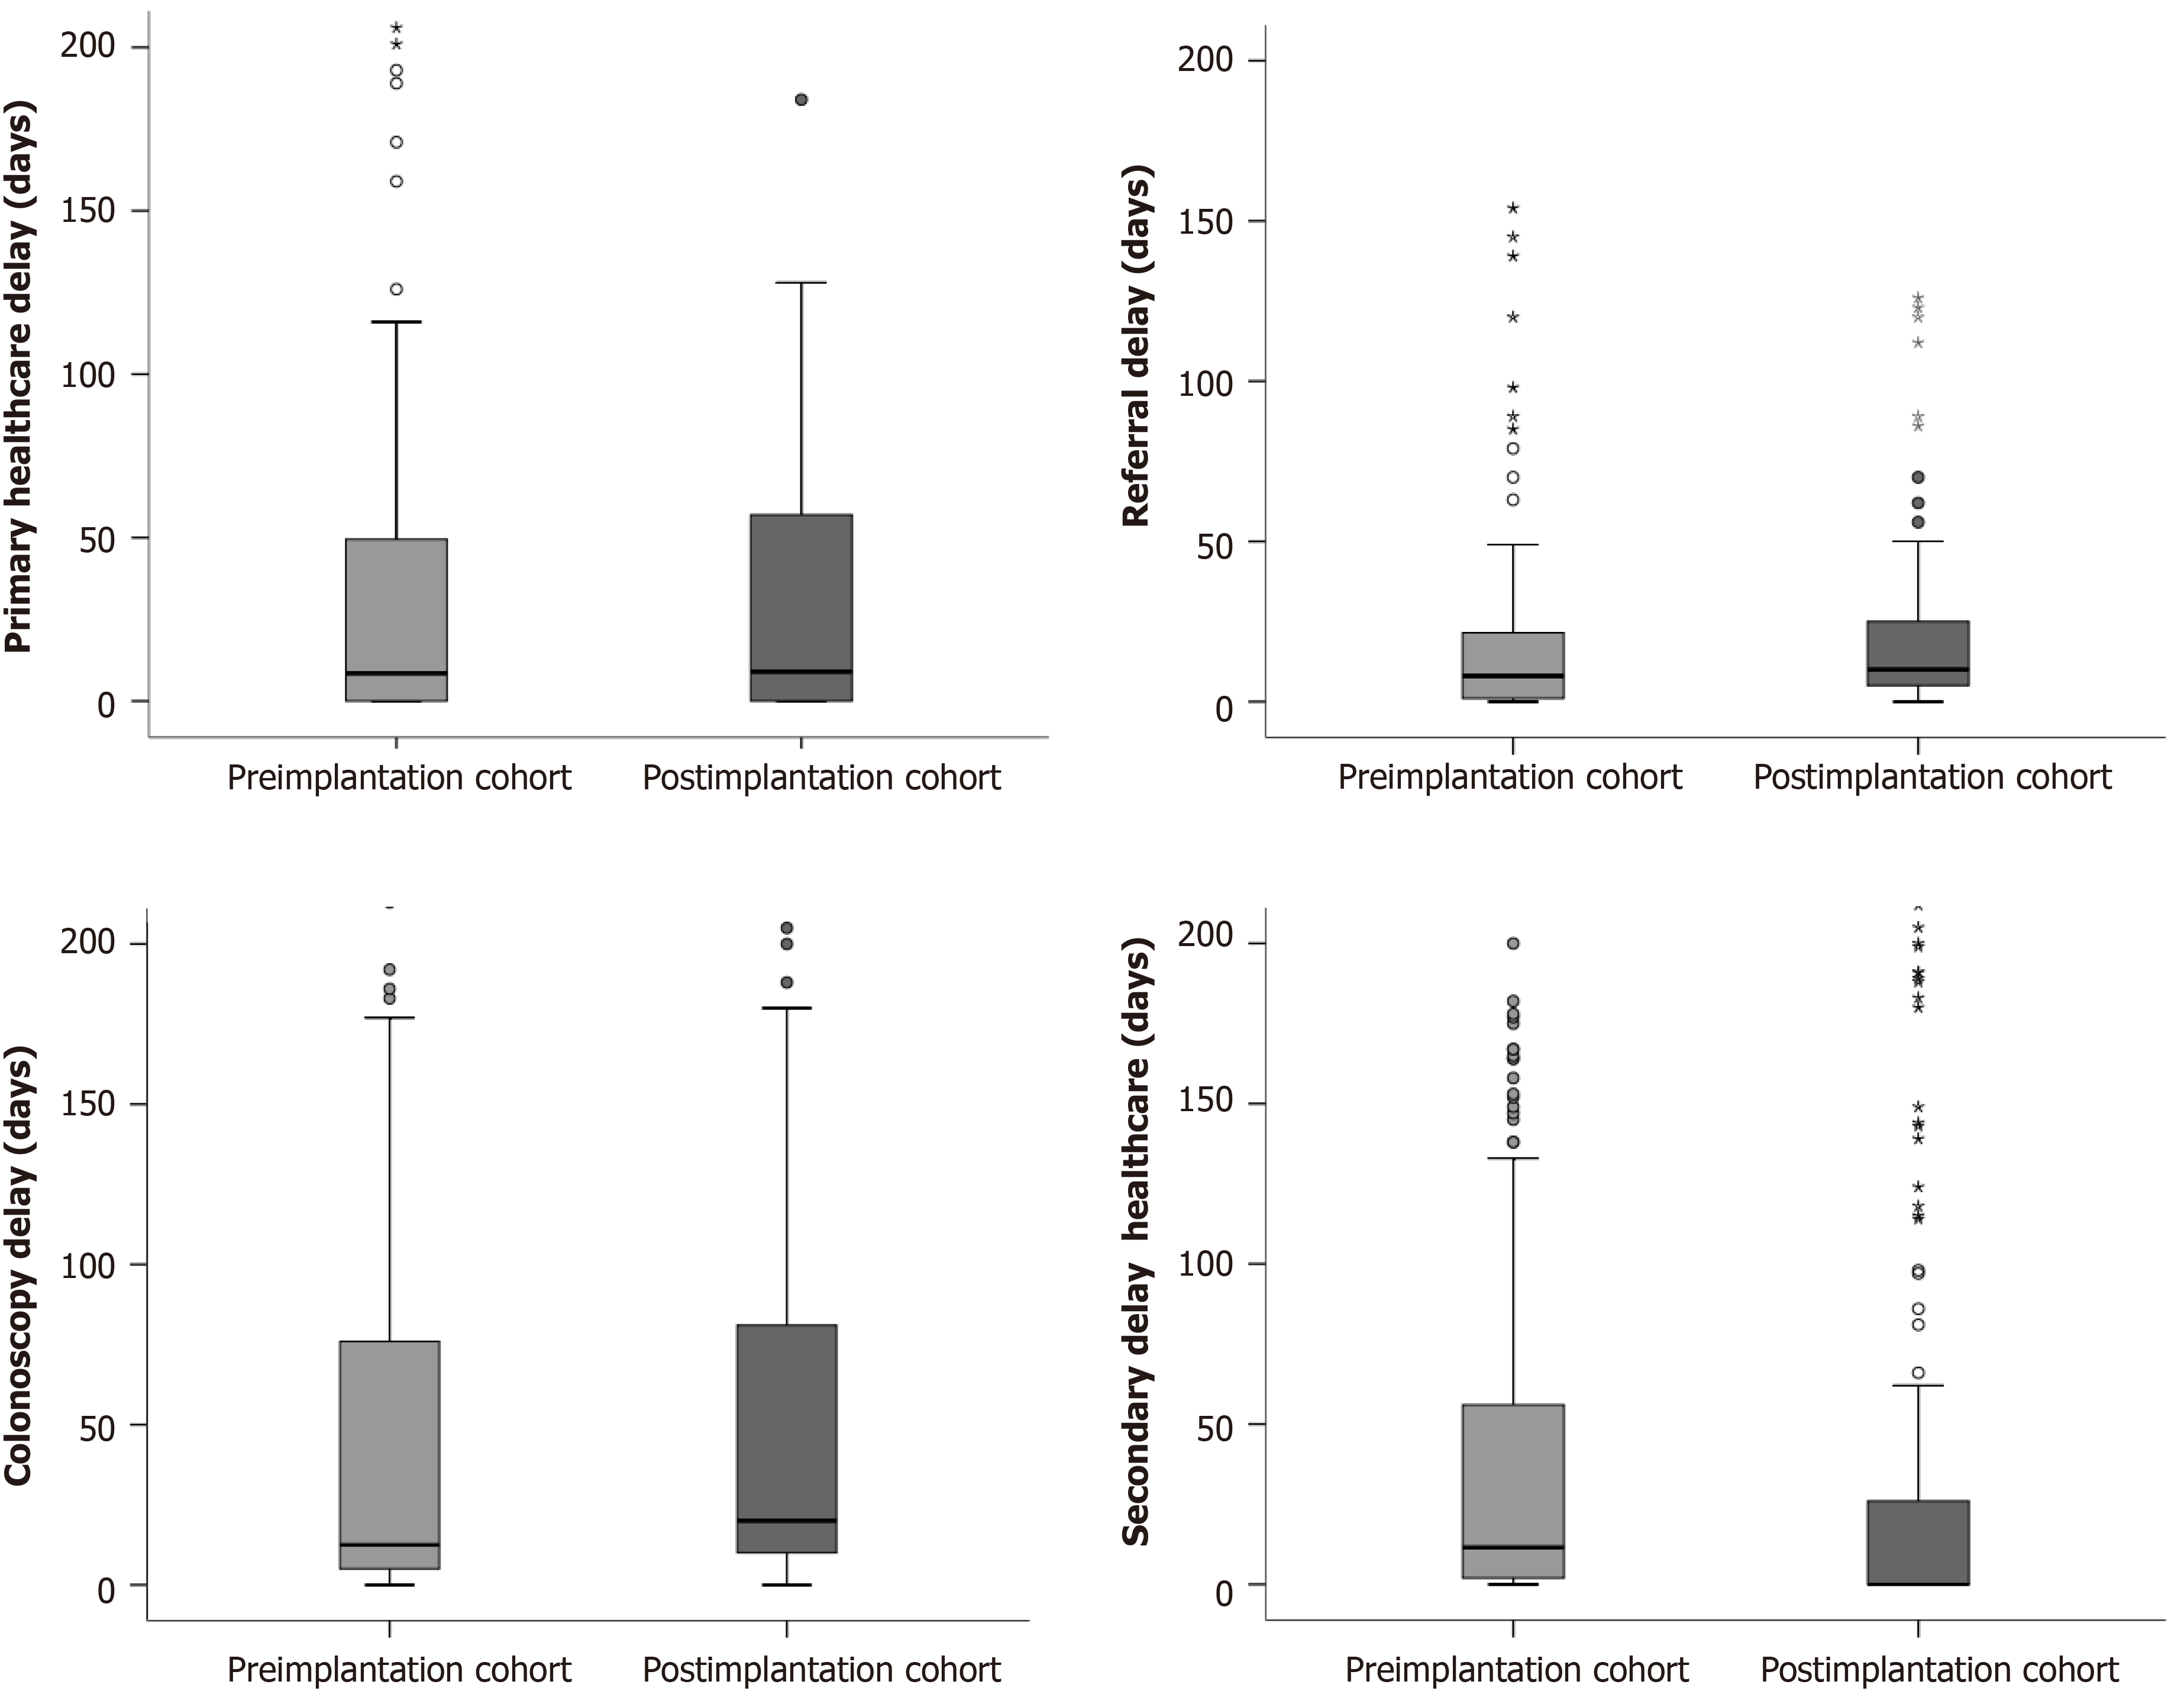
Figure 3 Healthcare diagnostic delays.
We show the distribution of the primary and secondary healthcare, referral and colonoscopy delays expressed in days.
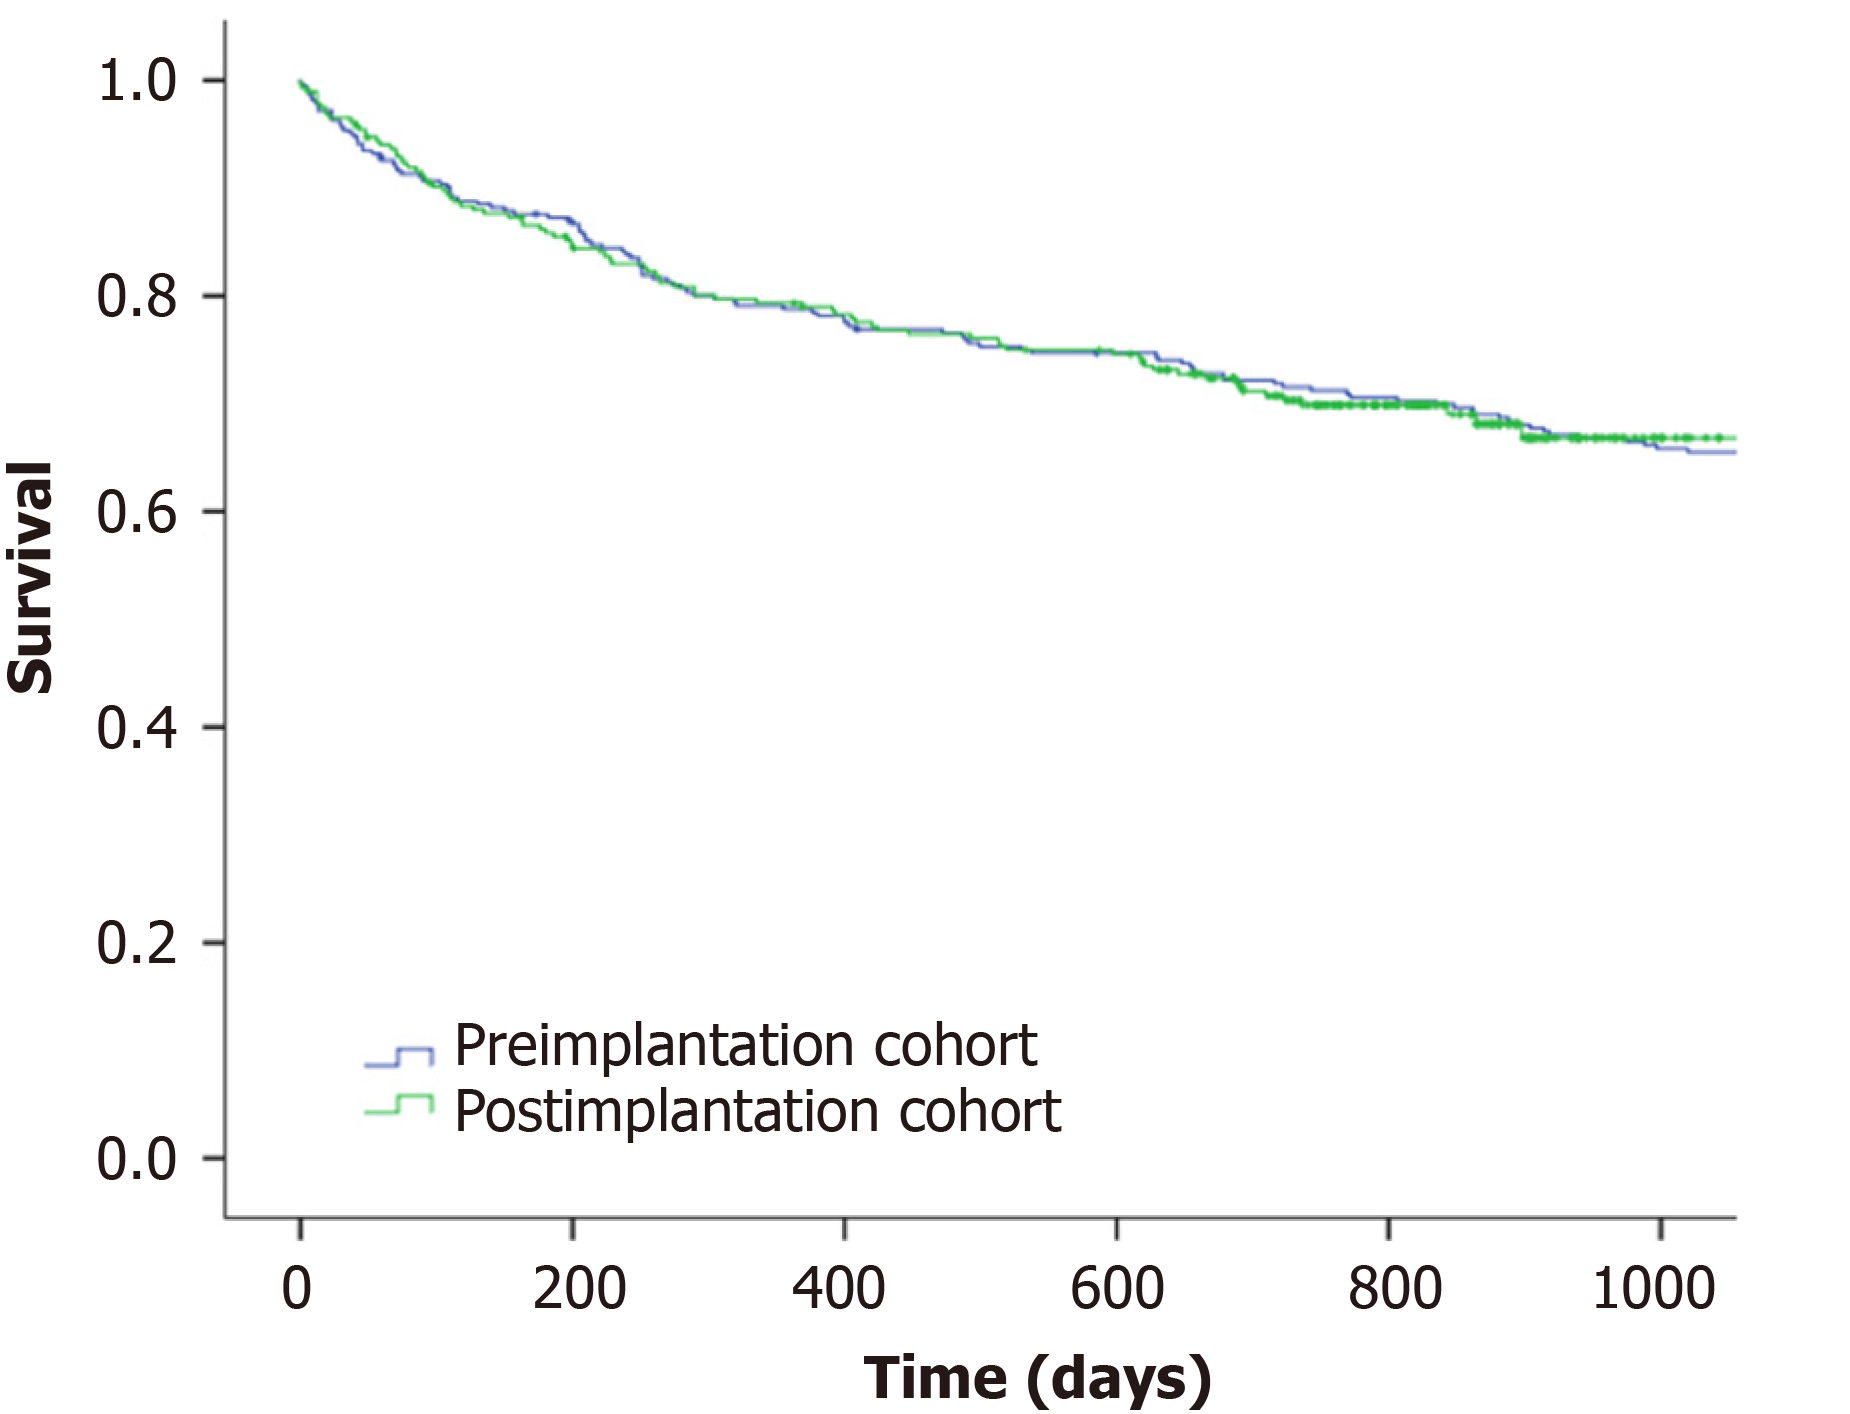
Figure 4 Survival curves of the pre and post-implantation cohorts.
Survival curves were calculated using the Kaplan-Meier method.
- Citation: Cubiella J, Lorenzo M, Baiocchi F, Tejido C, Conde A, Sande-Meijide M, Castro M. Impact of a colorectal cancer screening program implantation on delays and prognosis of non-screening detected colorectal cancer. World J Gastroenterol 2021; 27(39): 6689-6700
- URL: https://www.wjgnet.com/1007-9327/full/v27/i39/6689.htm
- DOI: https://dx.doi.org/10.3748/wjg.v27.i39.6689


