Copyright
©The Author(s) 2021.
World J Gastroenterol. Oct 21, 2021; 27(39): 6659-6672
Published online Oct 21, 2021. doi: 10.3748/wjg.v27.i39.6659
Published online Oct 21, 2021. doi: 10.3748/wjg.v27.i39.6659
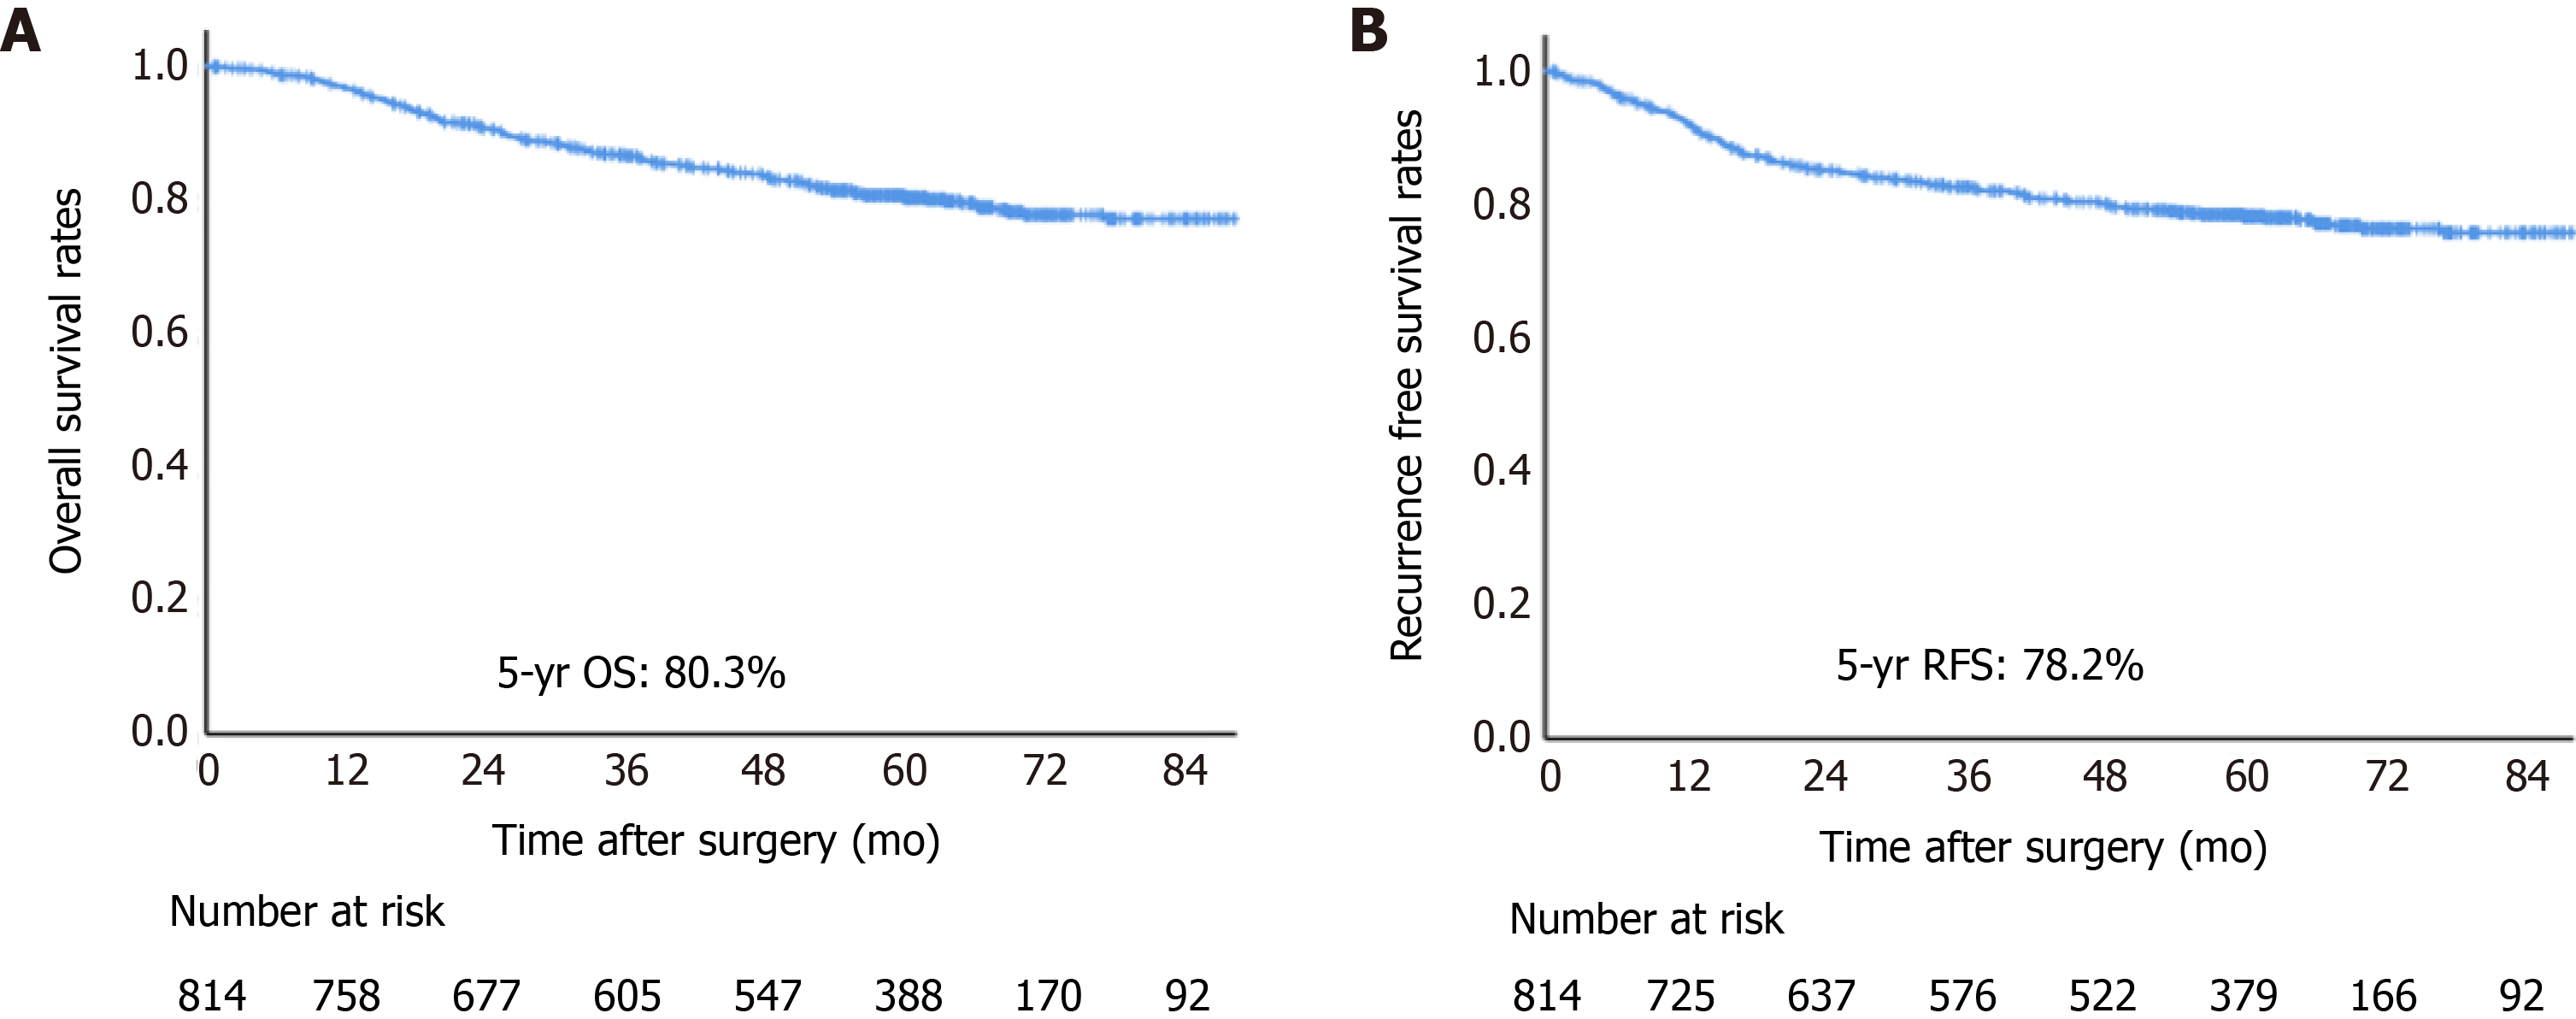
Figure 1 Kaplan-Meier curves.
Kaplan-Meier estimates in the entire cohort A: Overall survival probability; B: Recurrence-free survival probability. OS: Overall survival; RFS: Recurrence-free survival.
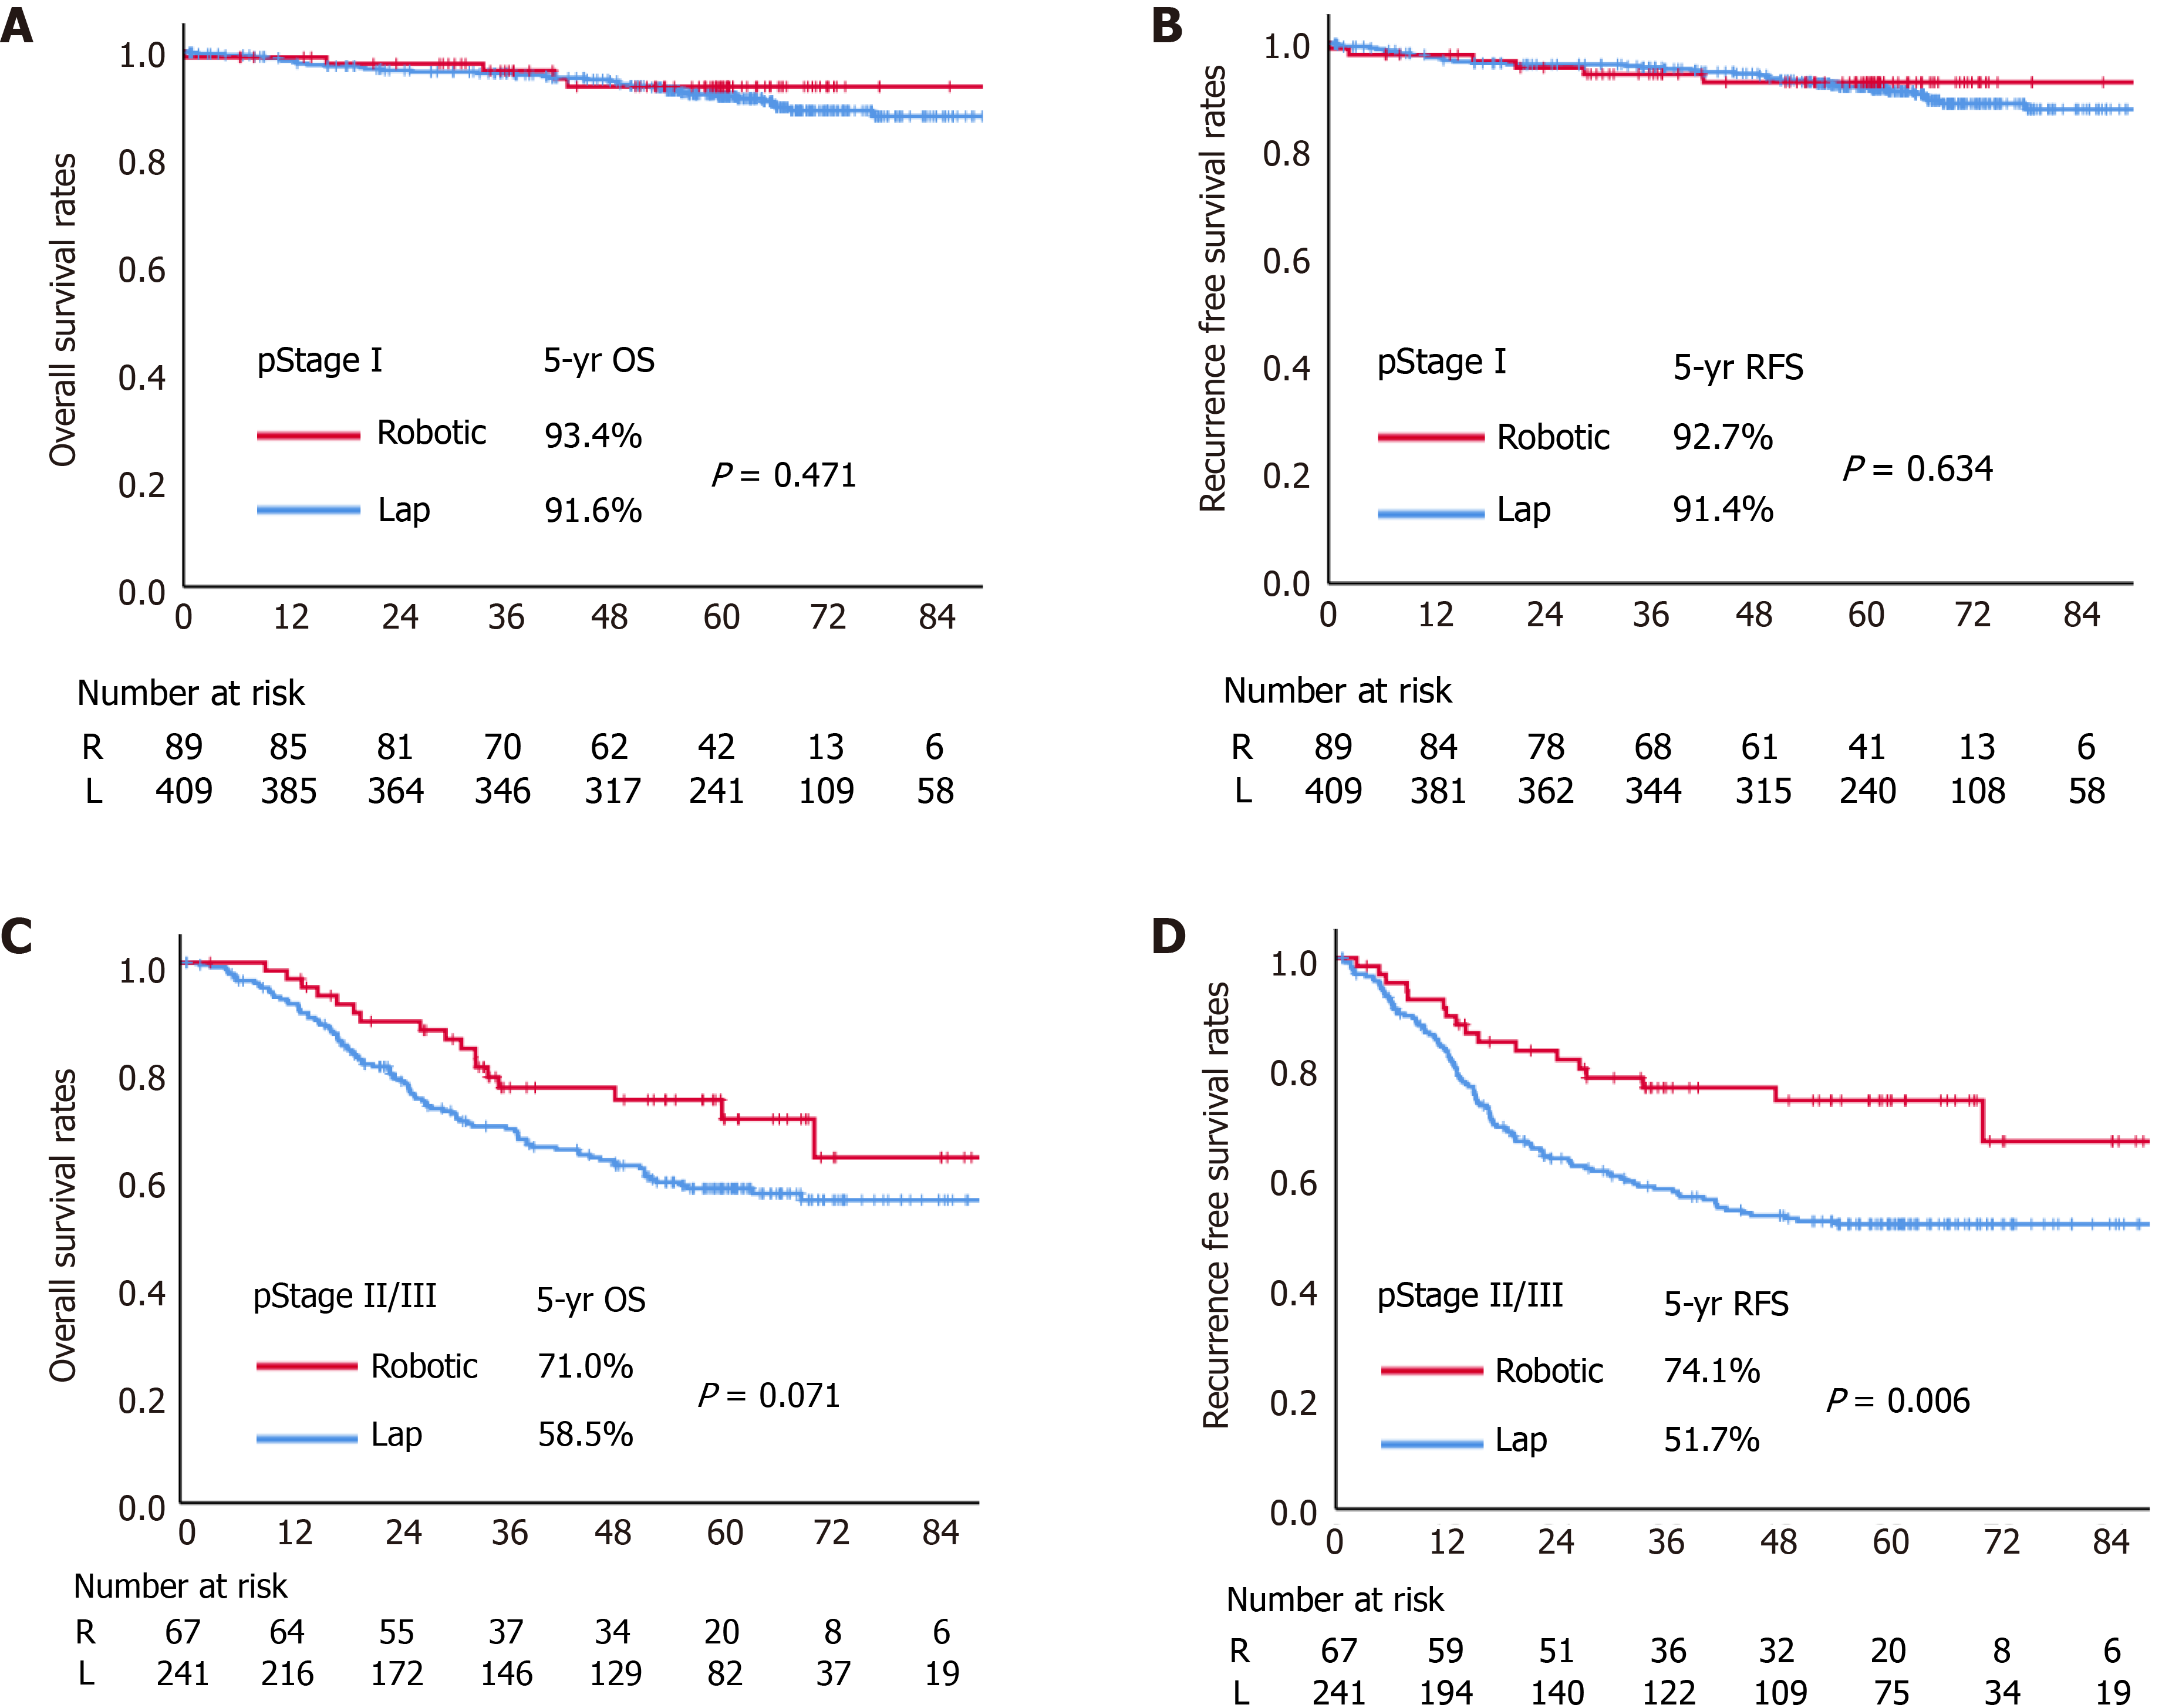
Figure 2 Kaplan-Meier curves.
A and C: Kaplan–Meier estimates of overall survival probability for pathological stage I and II/III, B and D: Kaplan–Meier estimates of recurrence-free survival probability for pathological stage I and II/III. OS: Overall survival; RFS: Recurrence-free survival.
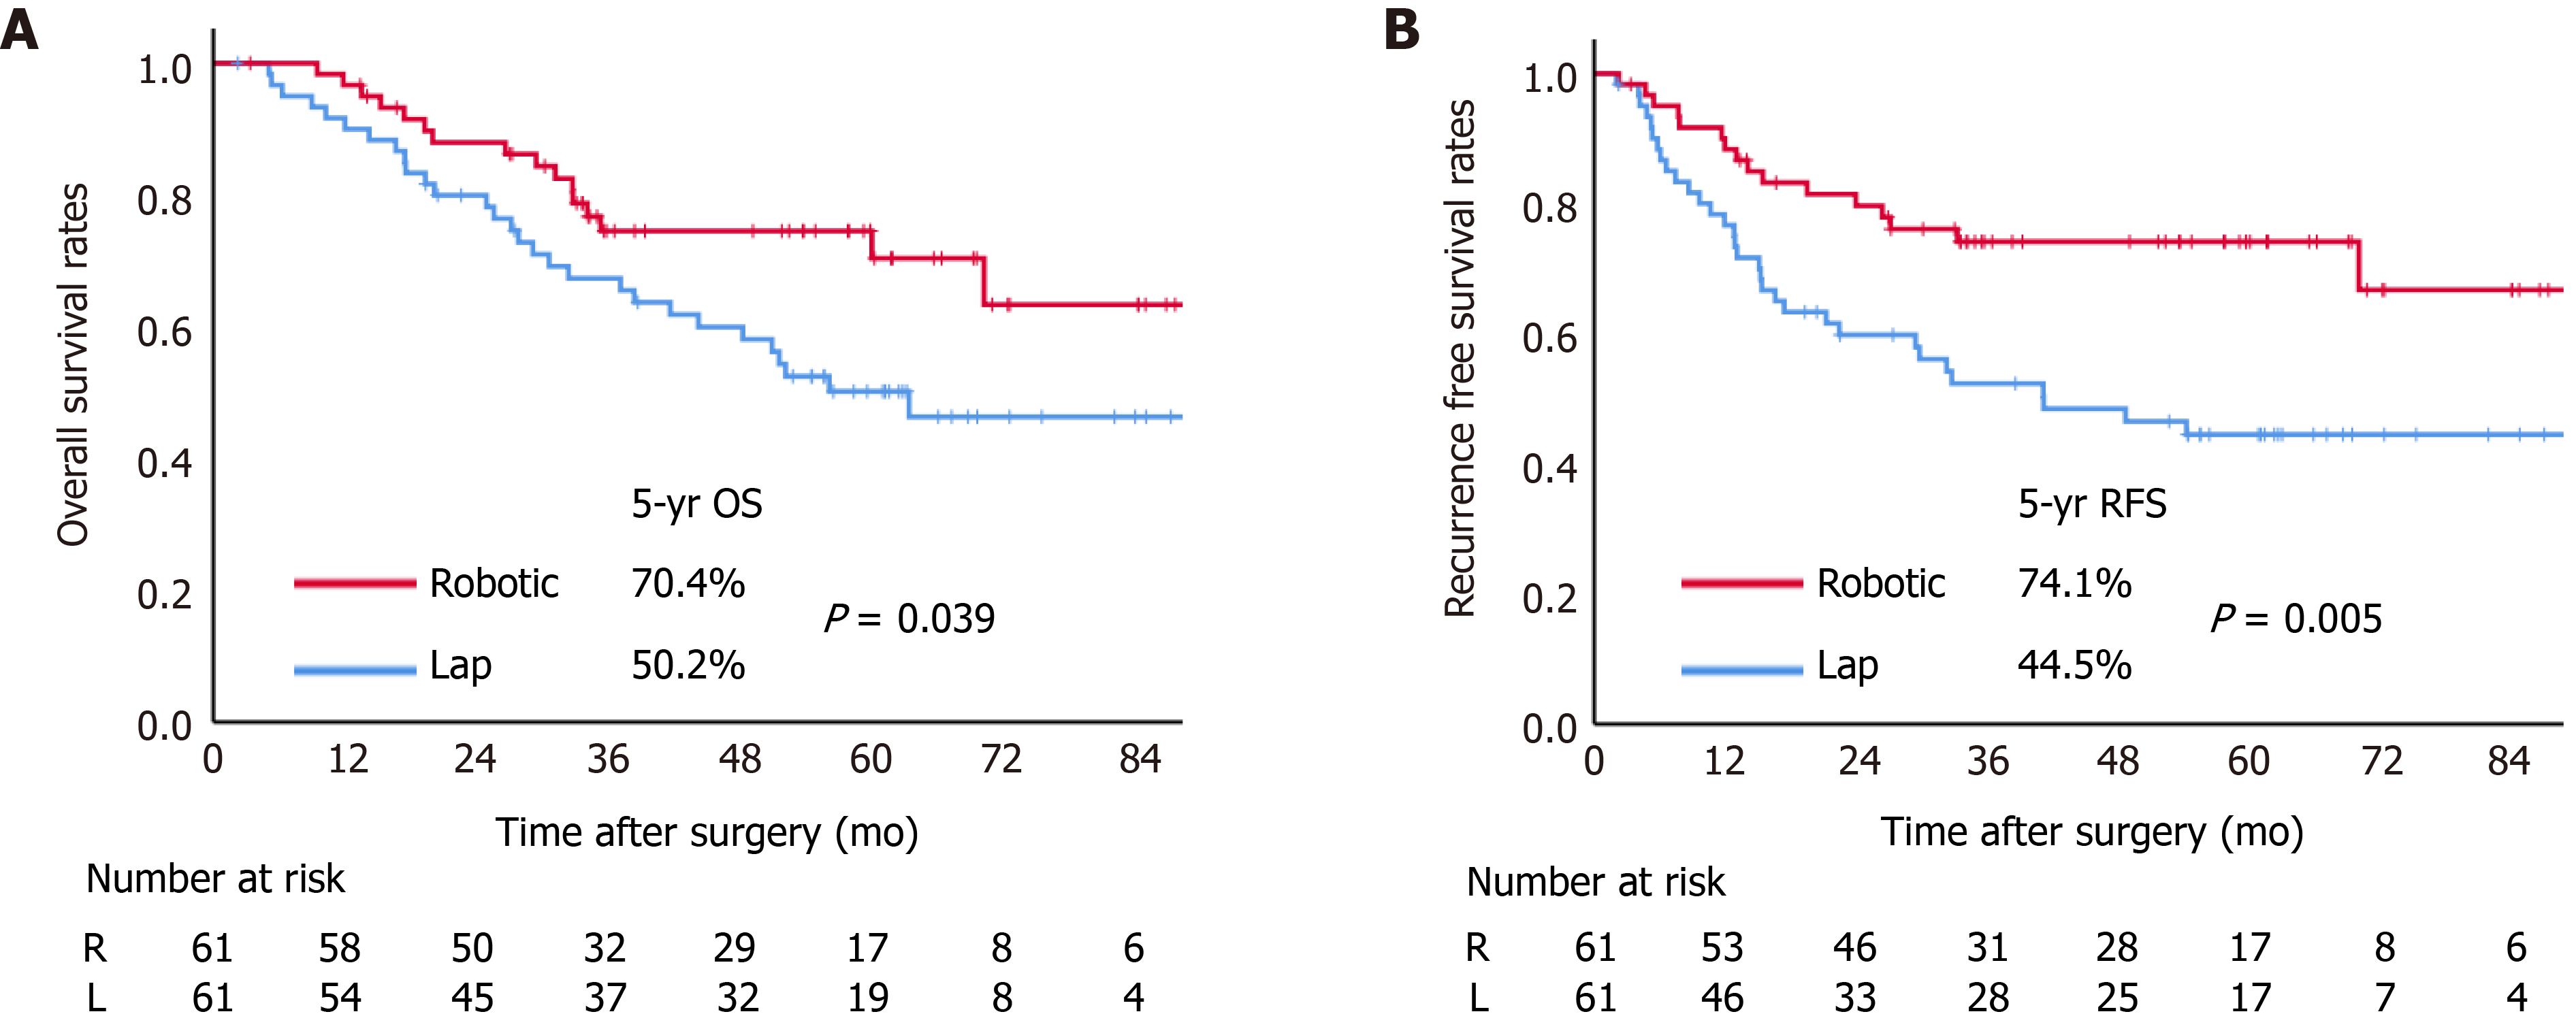
Figure 3 Kaplan-Meier curves.
Kaplan-Meier estimates in the postmatched cohort. A: Overall survival probability; B: Recurrence-free survival probability. OS: Overall survival; RFS: Recurrence-free survival.
- Citation: Nakauchi M, Suda K, Shibasaki S, Nakamura K, Kadoya S, Kikuchi K, Inaba K, Uyama I. Prognostic factors of minimally invasive surgery for gastric cancer: Does robotic gastrectomy bring oncological benefit? World J Gastroenterol 2021; 27(39): 6659-6672
- URL: https://www.wjgnet.com/1007-9327/full/v27/i39/6659.htm
- DOI: https://dx.doi.org/10.3748/wjg.v27.i39.6659


