Copyright
©The Author(s) 2021.
World J Gastroenterol. Jan 21, 2021; 27(3): 281-293
Published online Jan 21, 2021. doi: 10.3748/wjg.v27.i3.281
Published online Jan 21, 2021. doi: 10.3748/wjg.v27.i3.281
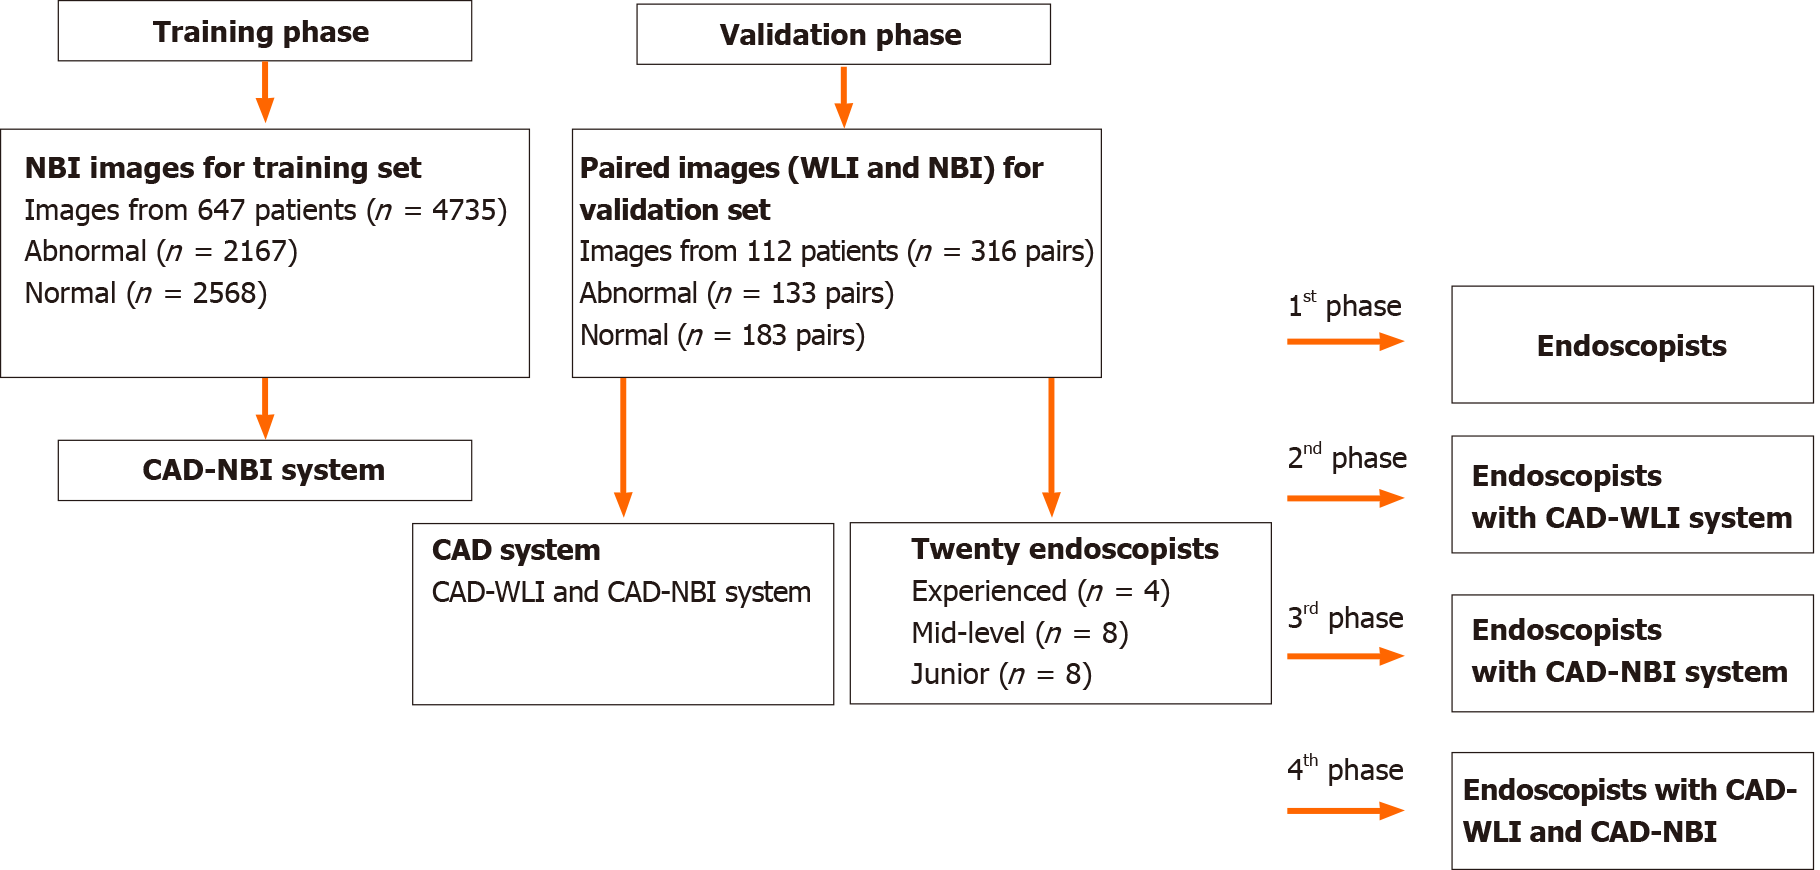
Figure 1 Flowchart of the procedures.
CAD: Computer-assisted detection; NBI: Narrow-band imaging; WLI: White -light imaging.
Figure 2 Receiver operating characteristic curve for the test dataset.
The area under the curve (AUC) was above 97%.
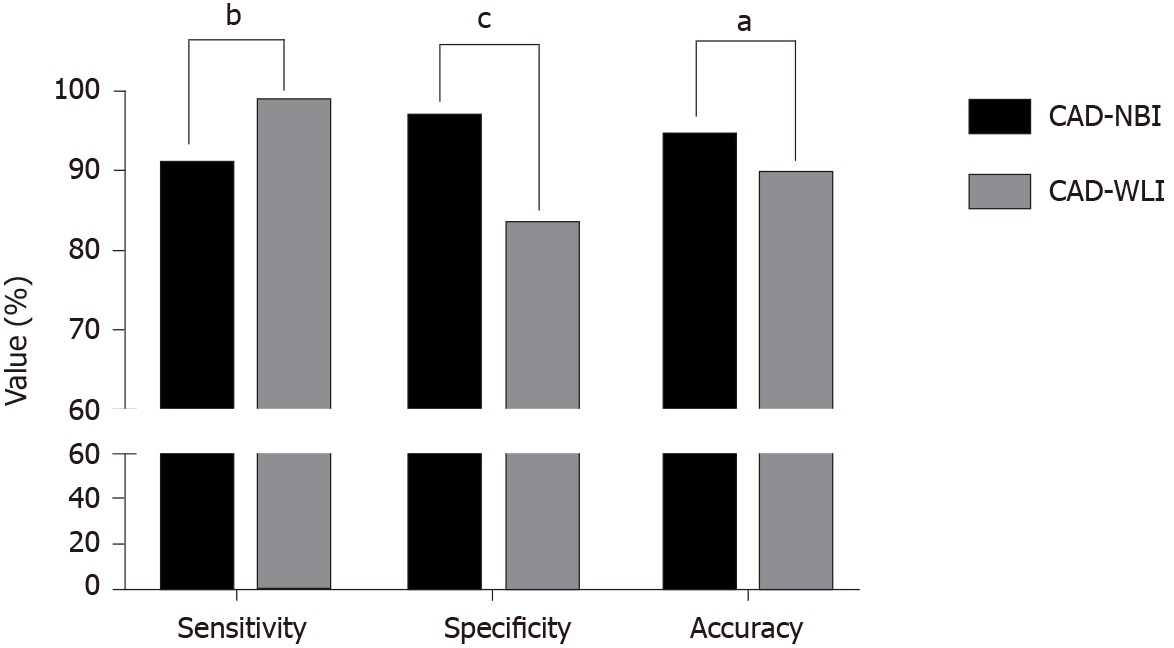
Figure 3 A comparison between the computer-assisted detection-narrow-band imaging and computer-assisted detection-white-light imaging systems in detecting early esophageal squamous cell carcinoma.
aP < 0.05; bP < 0.01; cP < 0.001. CAD: Computer-assisted detection; NBI: Narrow-band imaging; WLI: White-light imaging.
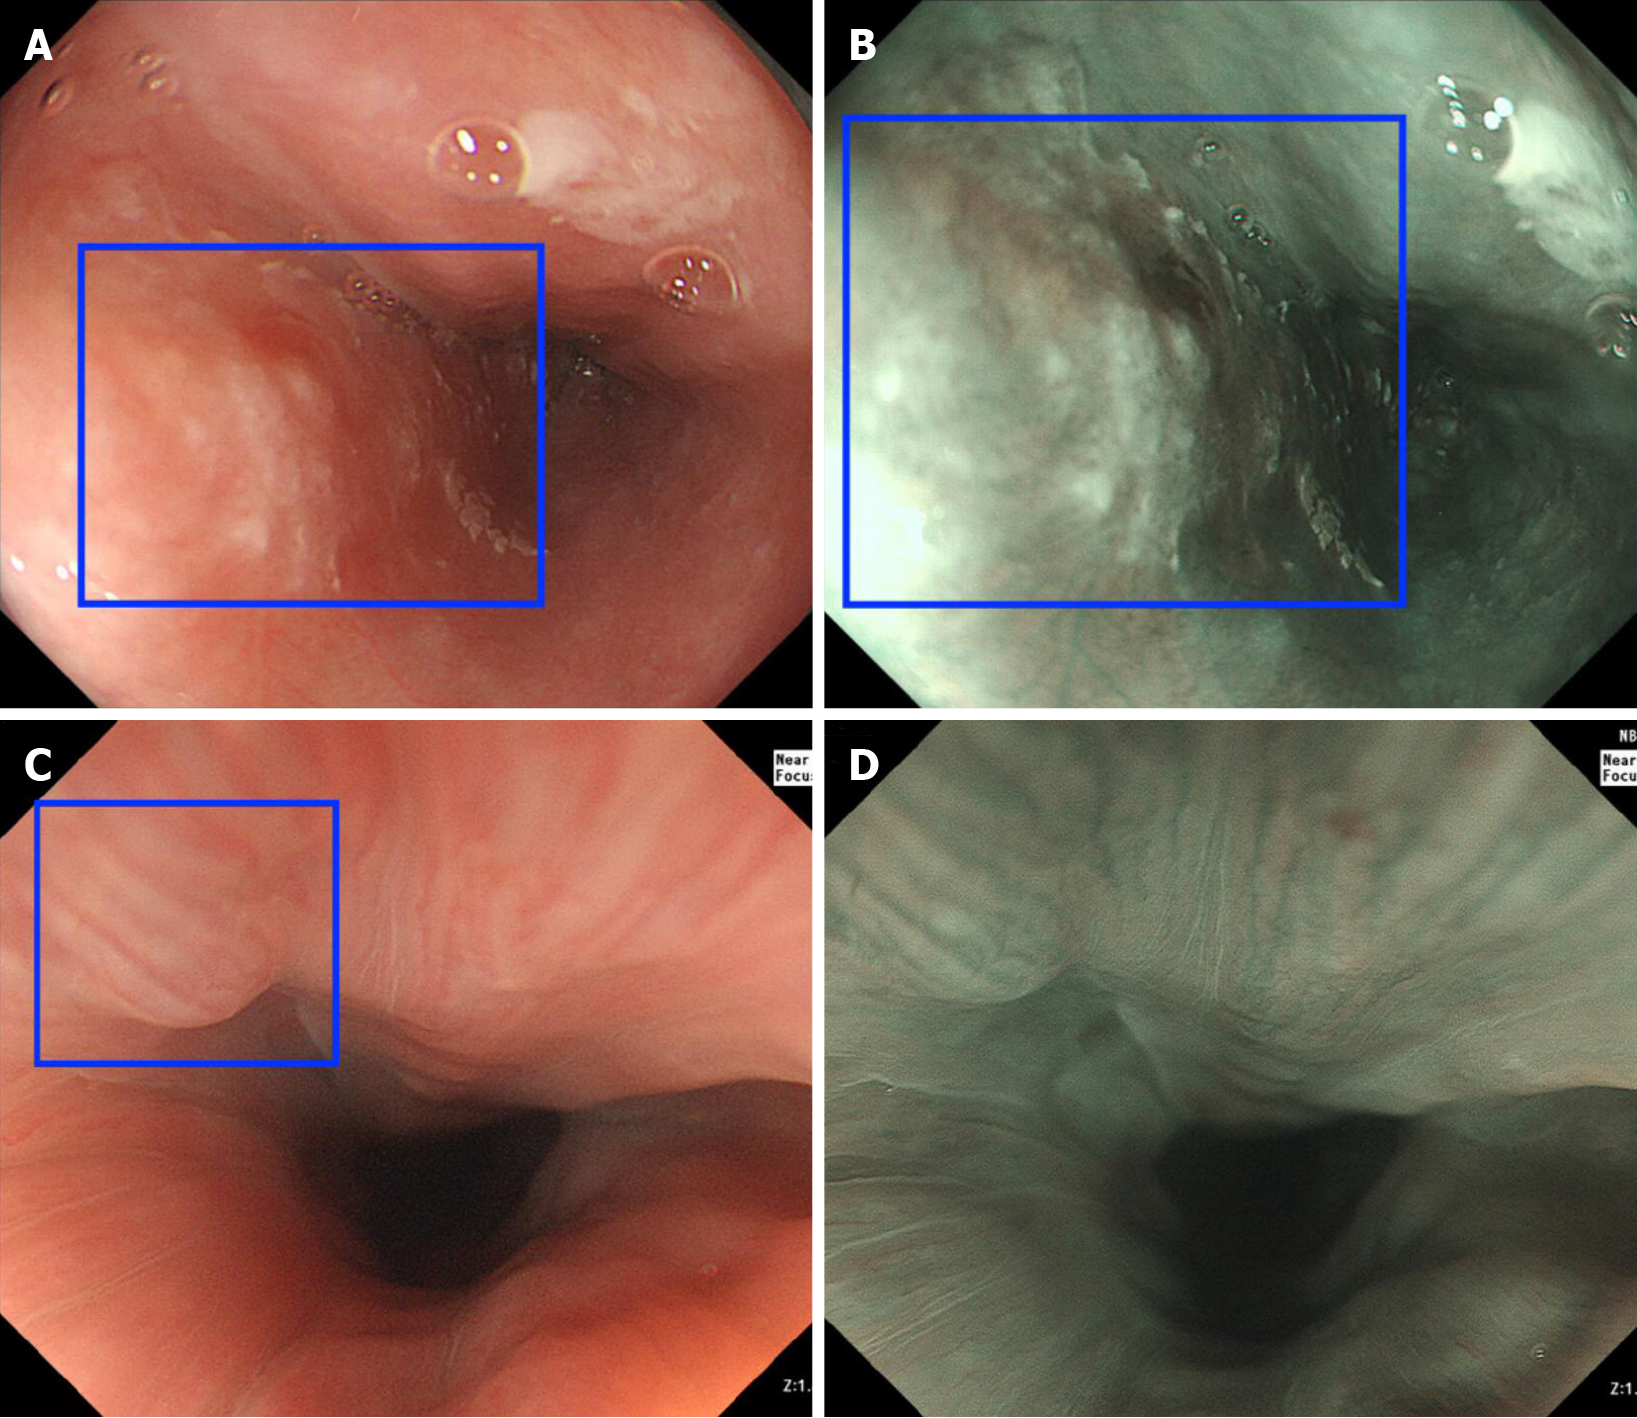
Figure 4 Examples of computer-assisted detection system-diagnosed images.
A and B: under white-light imaging (WLI) and narrow-band imaging (NBI), computer-assisted detection (CAD)-WLI and CAD-NBI recognized the esophageal cancer lesion (blue square); C and D: CAD-WLI mistakenly identified the normal mucosa as a lesion (blue square) in WLI, while CAD-NBI corrected it in NBI.
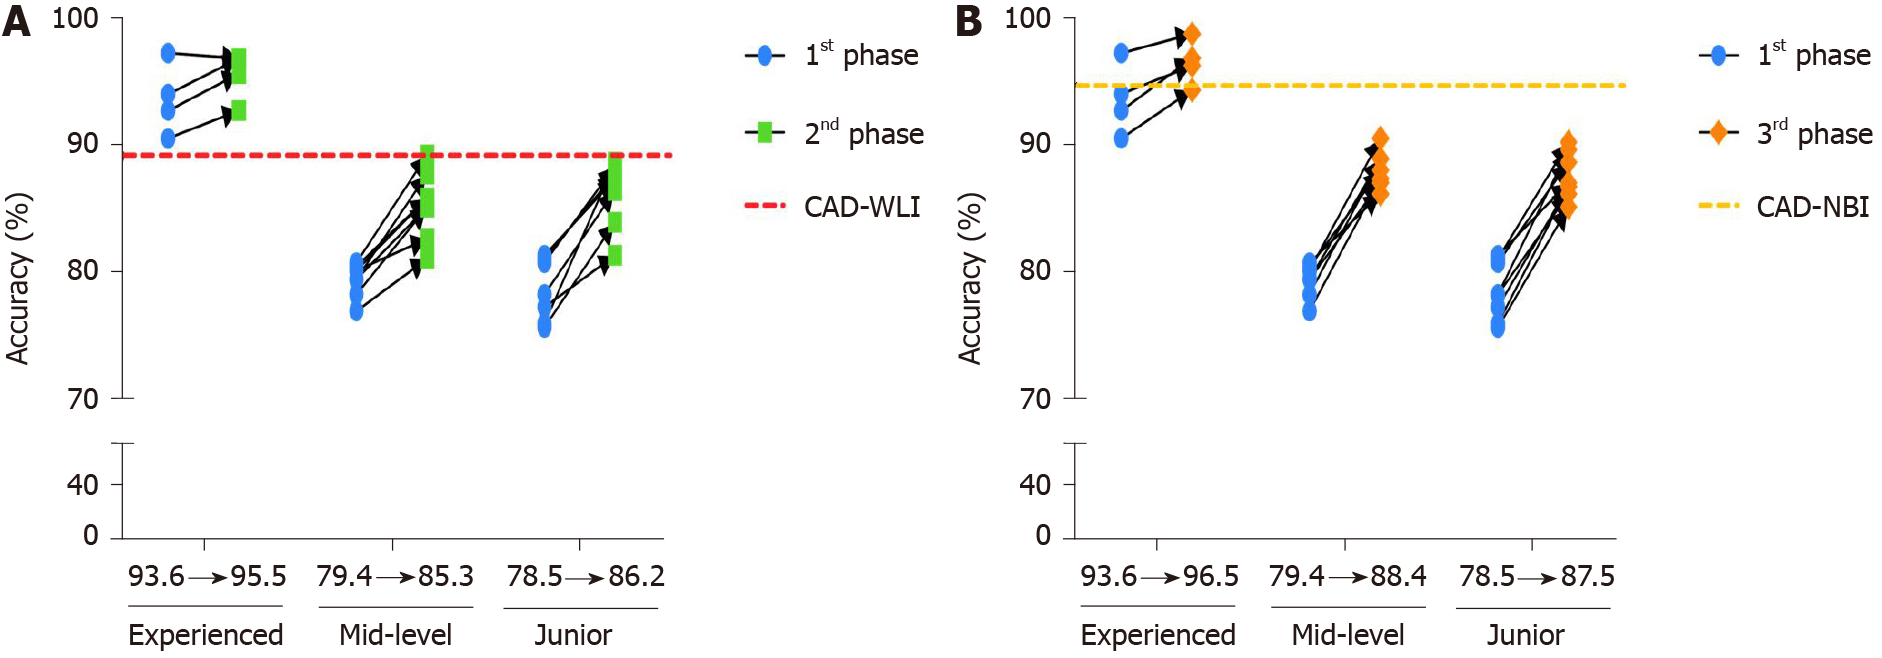
Figure 5 Improved accuracy of diagnosis with the assistance of the two computer-assisted detection systems according to the groups.
A: Improvement of endoscopists’ accuracy in the second phase with the assistance of computer-assisted detection (CAD)-white-light imaging; B: Improvement of endoscopists’ accuracy in the third phase with the assistance of CAD-narrow-band imaging. WLI: White-light imaging.
Figure 6 Average diagnostic performance of the three groups of endoscopists in four phases.
A: Accuracy; B: Sensitivity; C: Specificity. aP < 0.05; cP < 0.001.
- Citation: Li B, Cai SL, Tan WM, Li JC, Yalikong A, Feng XS, Yu HH, Lu PX, Feng Z, Yao LQ, Zhou PH, Yan B, Zhong YS. Comparative study on artificial intelligence systems for detecting early esophageal squamous cell carcinoma between narrow-band and white-light imaging. World J Gastroenterol 2021; 27(3): 281-293
- URL: https://www.wjgnet.com/1007-9327/full/v27/i3/281.htm
- DOI: https://dx.doi.org/10.3748/wjg.v27.i3.281


