Copyright
©The Author(s) 2021.
World J Gastroenterol. Jul 21, 2021; 27(27): 4395-4412
Published online Jul 21, 2021. doi: 10.3748/wjg.v27.i27.4395
Published online Jul 21, 2021. doi: 10.3748/wjg.v27.i27.4395
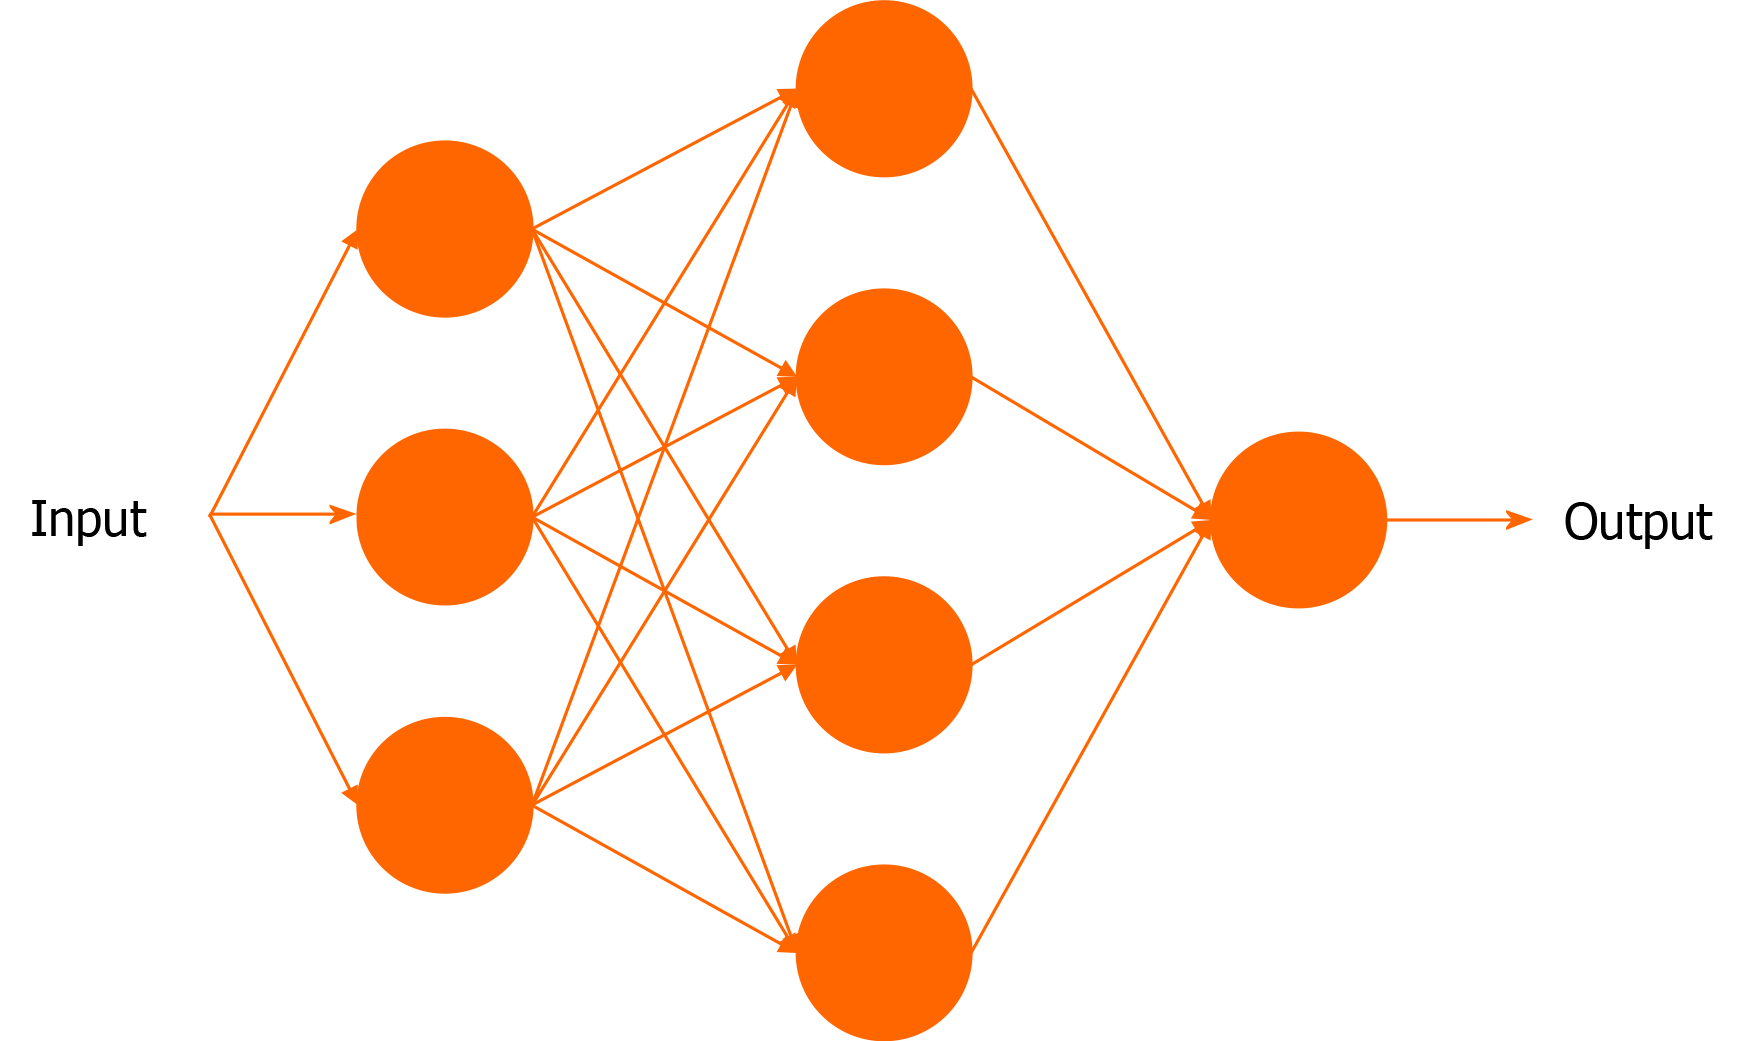
Figure 1 A neural network made up of 3 layers: An input layer, a hidden layer and an output layer.
The input data is taken by the neurons (shown as blue circles) in the input layer, and produce an output which is consumed by the next layer (hidden layer). They, in turn, perform similar computations and provide an output to the output layer, which yields a final output.
Figure 2 Conceptual example of a simple convolutional neural network used for classification of a stomach tumor.
Figure 3 PubMed results by year using the search terms.
A: Artificial intelligence; B: Artificial intelligence gastroenterology.
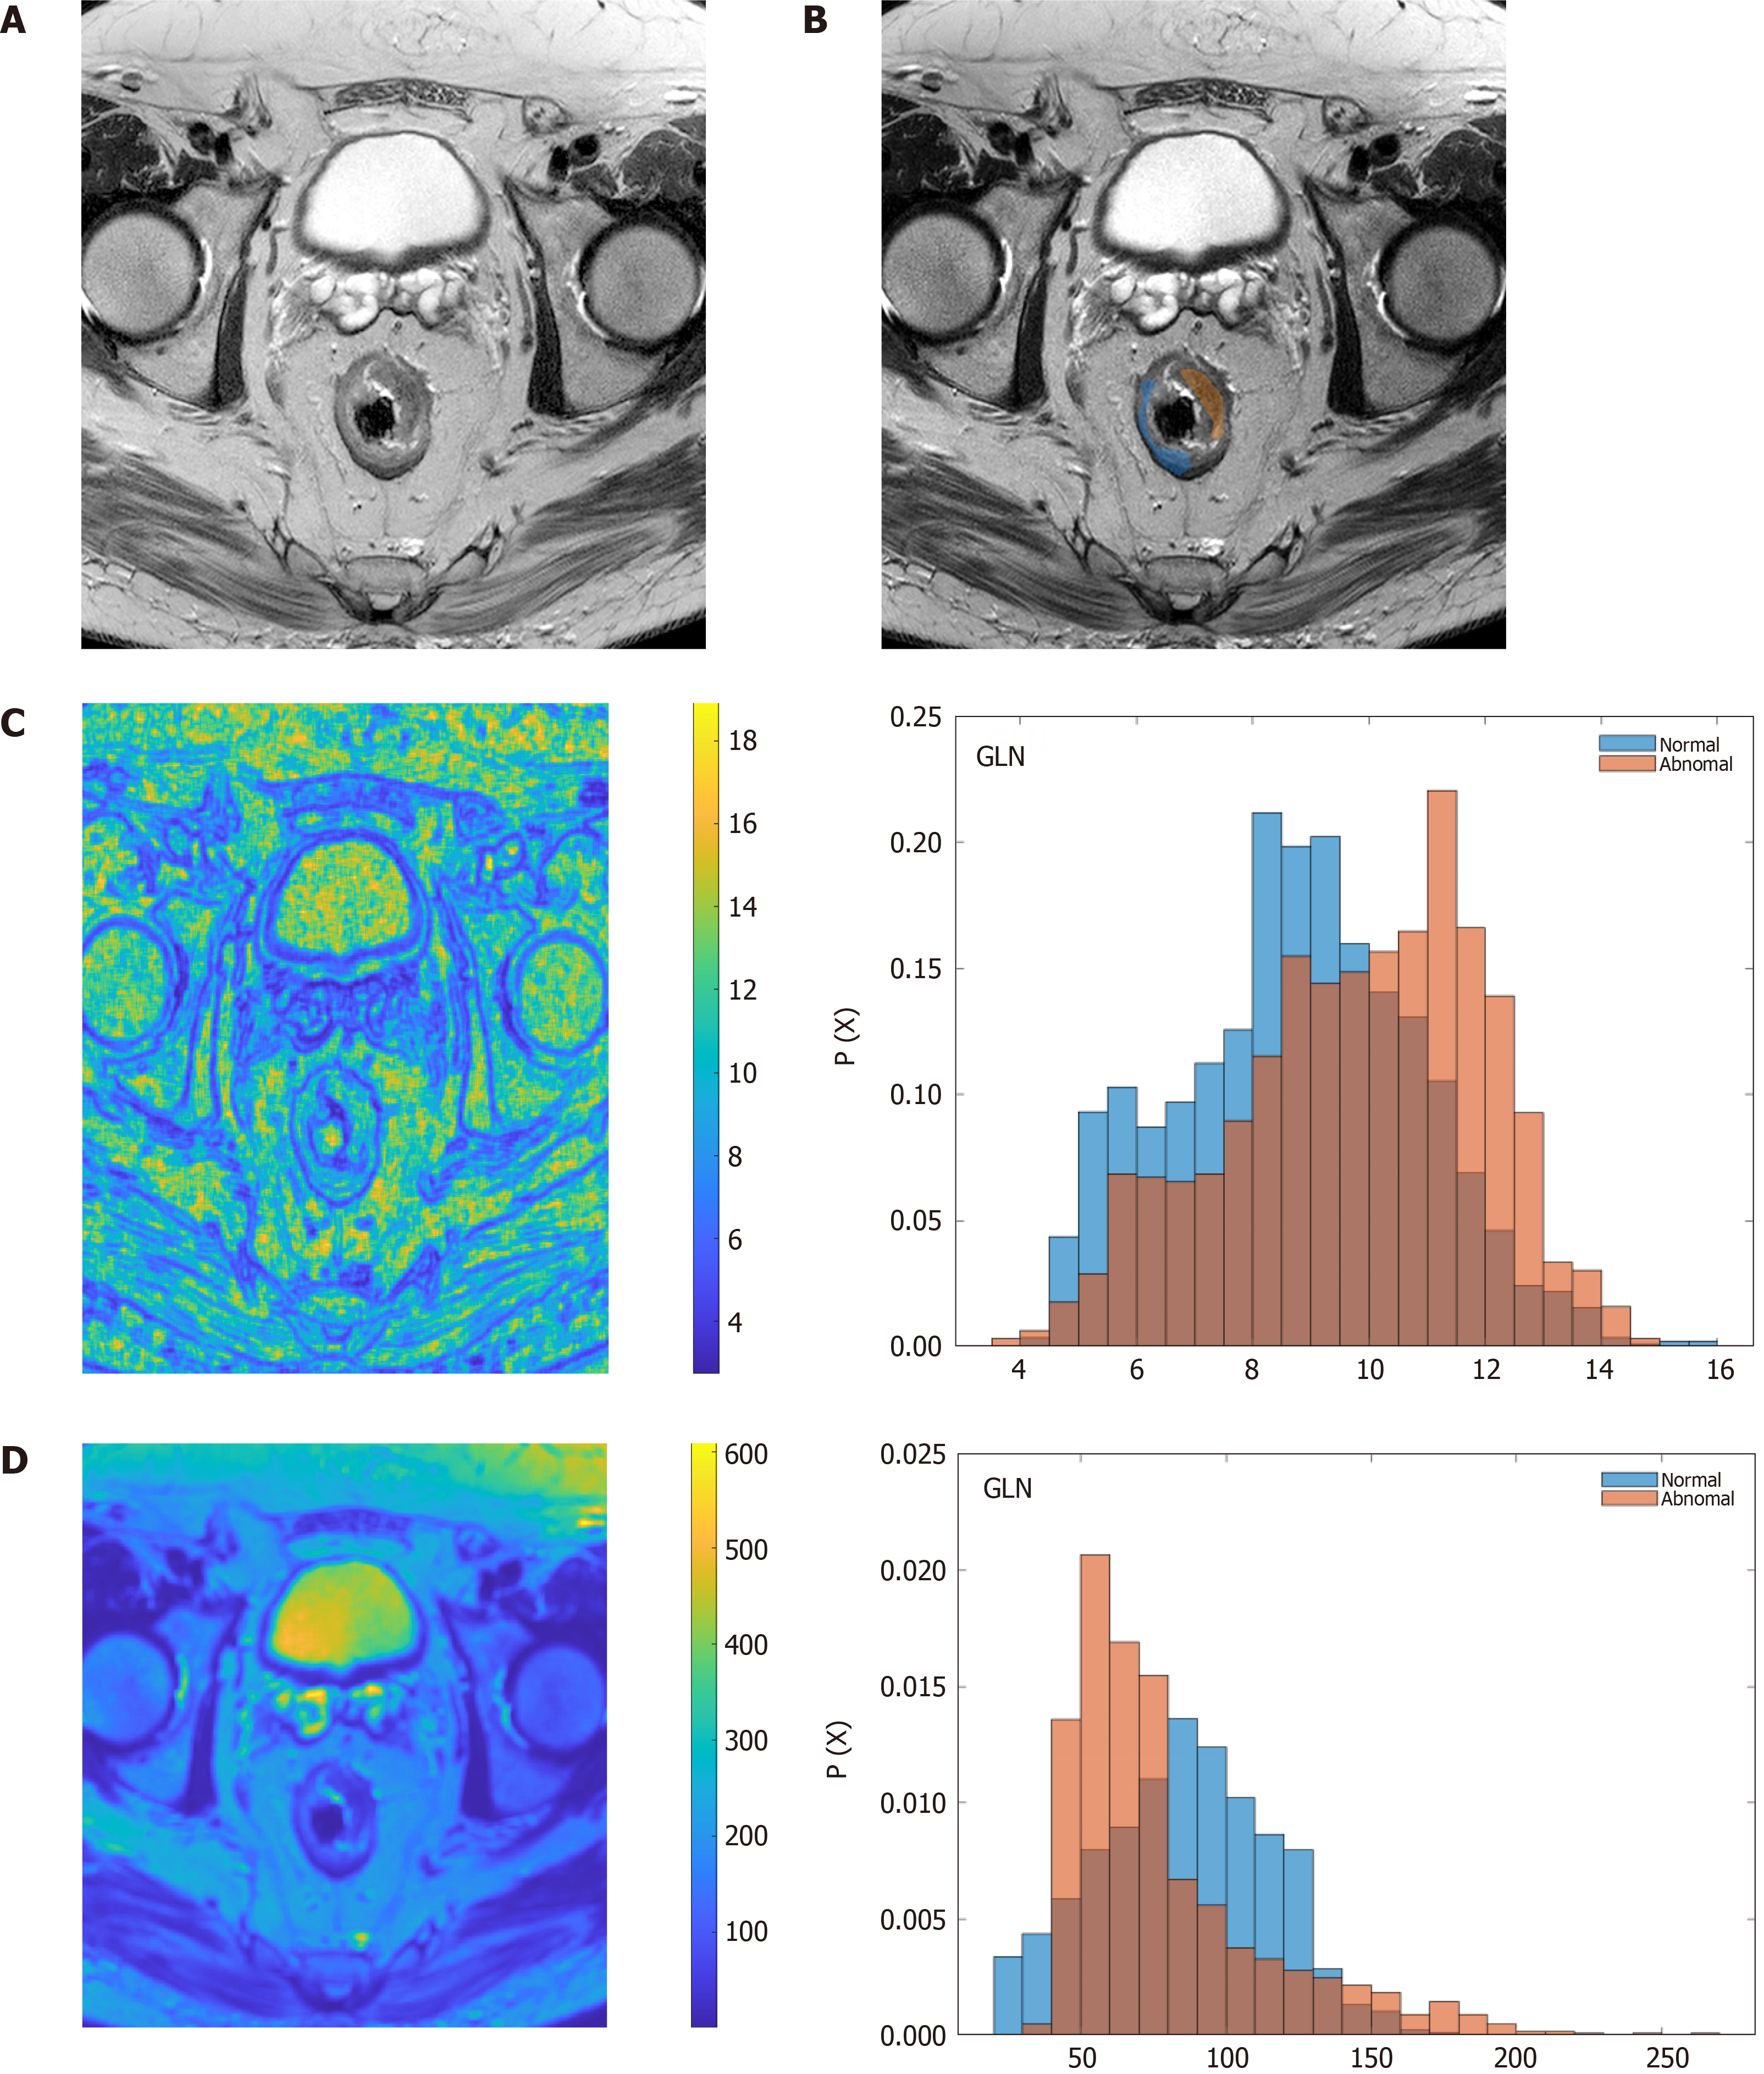
Figure 4 Texture analysis of rectal adenocarcinoma.
A: Original, axial T2-weighted image; B: Region of interest delineation of rectal tumor mass (orange) and normal tissue (blue); C and D: Parametric images and histograms of two different texture descriptors, showing differences between normal (blue) and tumor (brown) regions; C: Grey-level nonuniformity; D: High gray-level run emphasis. GLN: Grey-level nonuniformity; HGRE: High gray-level run emphasis.
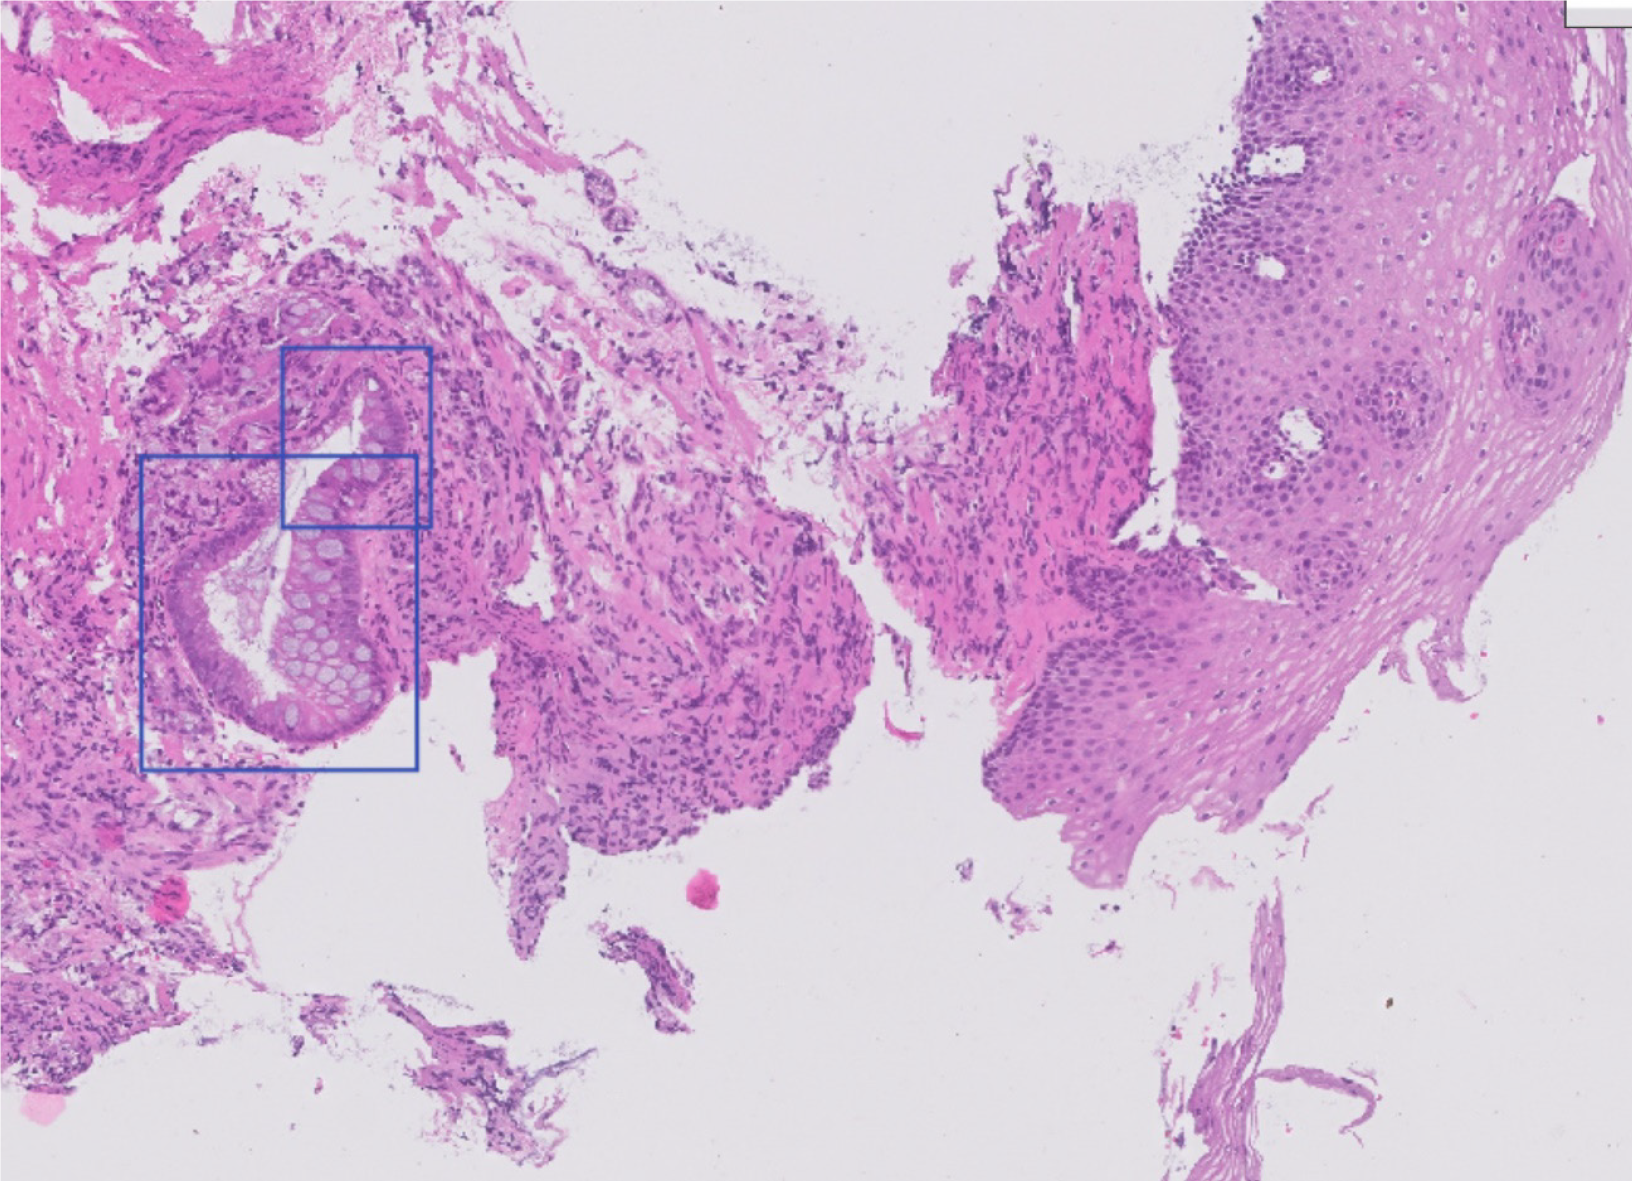
Figure 5 Automatic detection of intestinal metaplasia in a sample of esophagus tissue stained with hematoxylin and eosin.
Image analyzed with research software from Cells IA (https://cells-ia.com/).
Figure 6 Automatic detection of Helicobacter pylori infection in a gastric biopsy section stained with Warthin-Starry stain.
Image analyzed with research software from Cells IA (https://cells-ia.com/).
- Citation: Berbís MA, Aneiros-Fernández J, Mendoza Olivares FJ, Nava E, Luna A. Role of artificial intelligence in multidisciplinary imaging diagnosis of gastrointestinal diseases. World J Gastroenterol 2021; 27(27): 4395-4412
- URL: https://www.wjgnet.com/1007-9327/full/v27/i27/4395.htm
- DOI: https://dx.doi.org/10.3748/wjg.v27.i27.4395


