Copyright
©The Author(s) 2021.
World J Gastroenterol. Jun 21, 2021; 27(23): 3262-3278
Published online Jun 21, 2021. doi: 10.3748/wjg.v27.i23.3262
Published online Jun 21, 2021. doi: 10.3748/wjg.v27.i23.3262
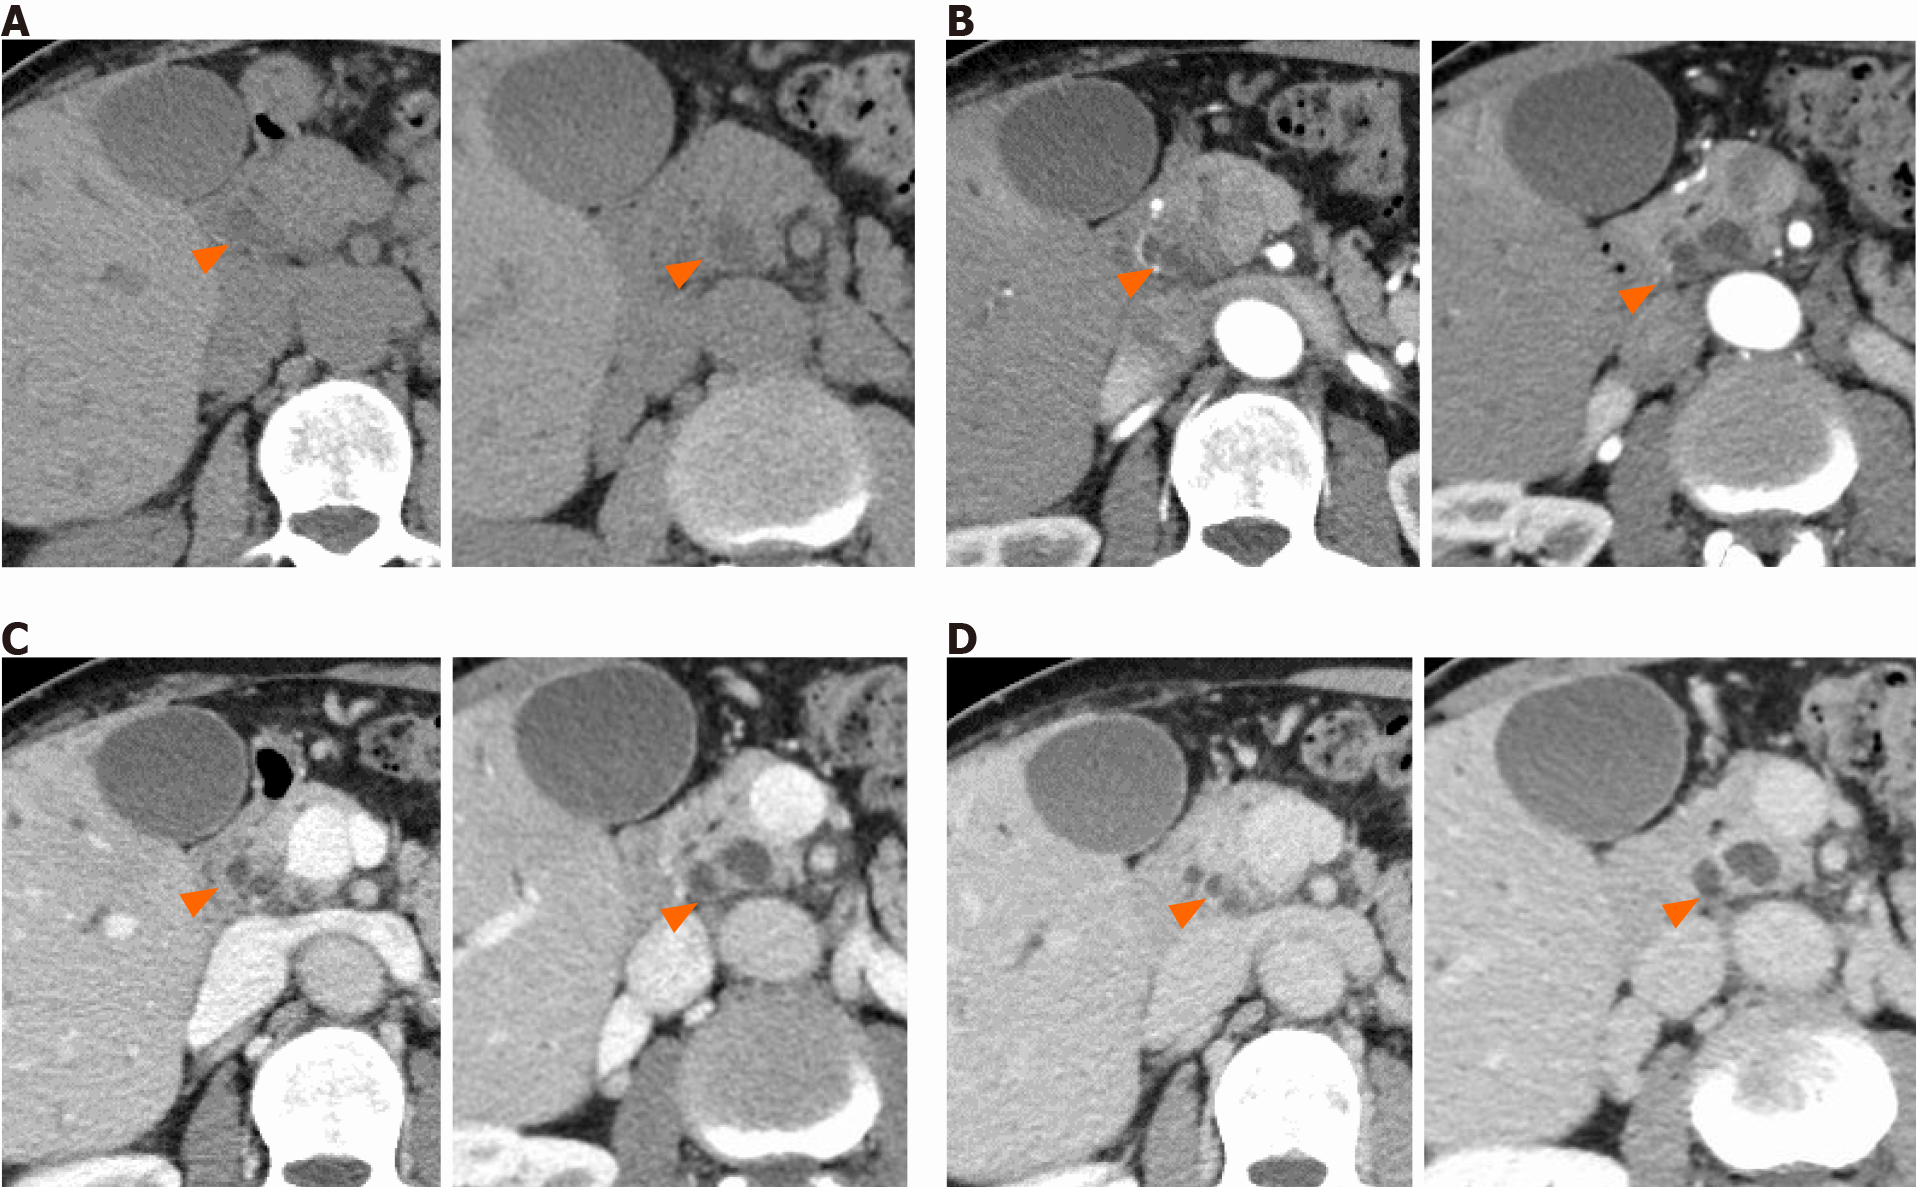
Figure 1 Typical computed tomography imaging of large-duct pancreatic ductal adenocarcinoma.
The orange arrowheads show the cystic lesion in large-duct pancreatic ductal adenocarcinoma. A: Plain computed tomography indicates low attenuation area in the pancreas; B: Arterial phase reveals multiple cystic lesions in the pancreatic head without enhancement; C: Portal phase shows multiple cystic lesions in the pancreatic head with parenchymal enhancement; D: Equilibrium phase shows slight ring enhancement of the lesion.
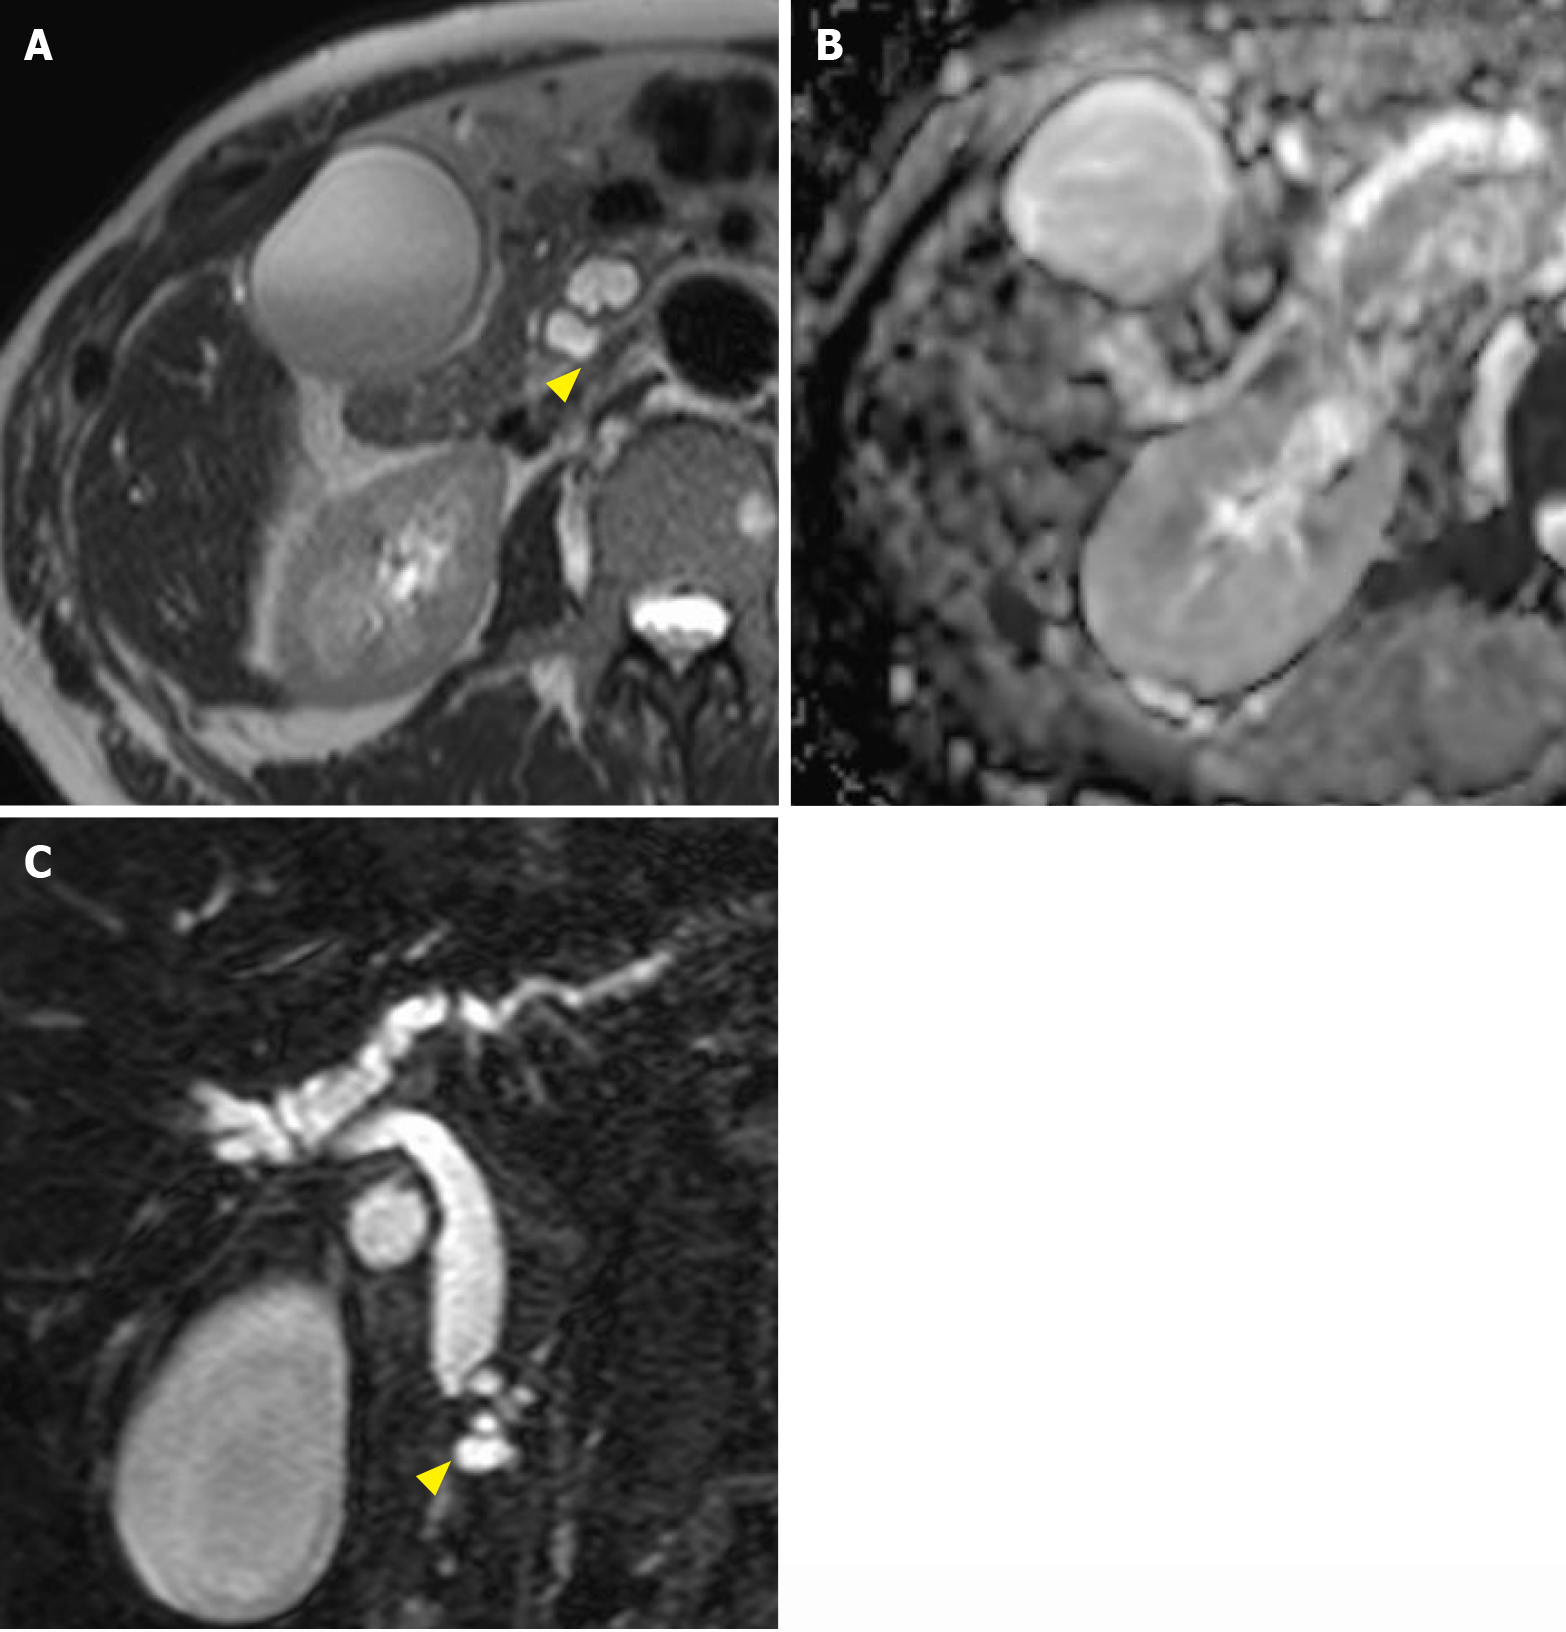
Figure 2 Typical magnetic resonance imaging of large-duct pancreatic ductal adenocarcinoma.
The yellow arrowheads show the cystic lesion in large-duct pancreatic ductal adenocarcinoma (PDA). A: T2-weighted imaging reveals high intensity in the large-duct PDA lesion; B: Diffusion-weighted imaging shows no significant signal increase/decrease in the lesion; C: Magnetic resonance cholangiopancreatography (coronal view) reveals multiple cystic lesions in the pancreatic head and compressed bile duct.
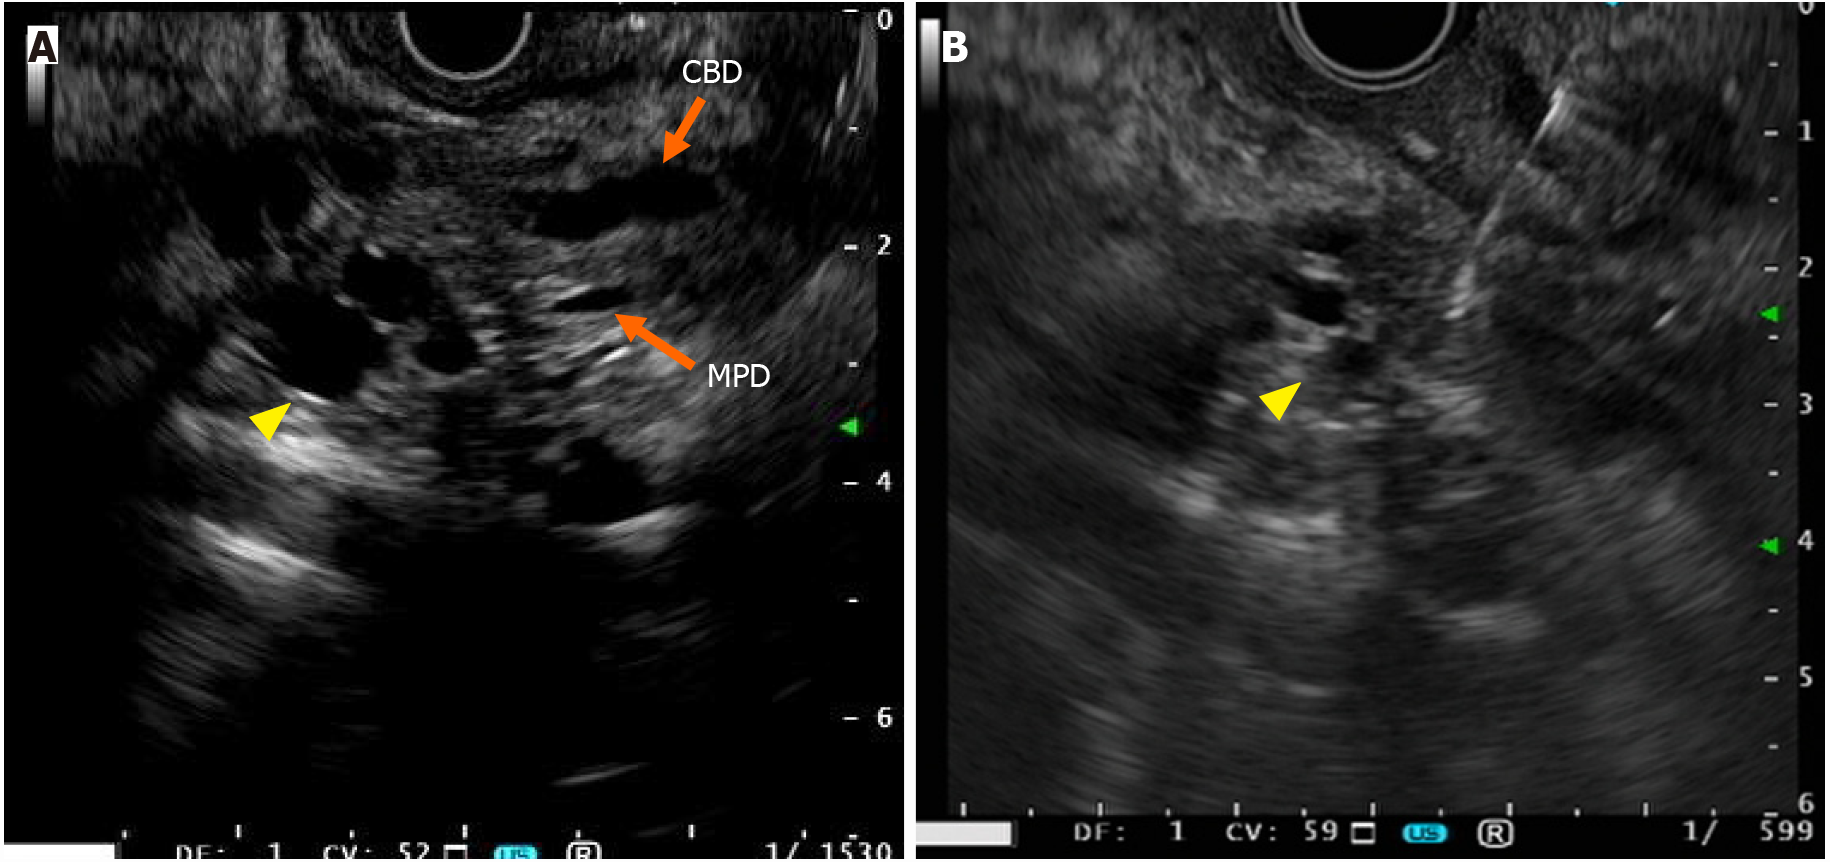
Figure 3 Endoscopic ultrasonography findings of large-duct pancreatic ductal adenocarcinoma.
The yellow arrowhead shows the cystic lesion in large-duct pancreatic ductal adenocarcinoma (PDA). A: Endoscopic ultrasonography (EUS) reveals multiple echoic lesions in the pancreatic head; B: EUS-fine-needle aspiration was performed in the parenchyma of the cystic lesion in large-duct PDA. The EUS model used was GF-UE260-AL5 (Olympus, Tokyo, Japan). The ultrasonic diagnostic equipment used was EU-ME2 (Olympus, Tokyo, Japan). CBD: Common bile duct; MPD: Main pancreatic duct.
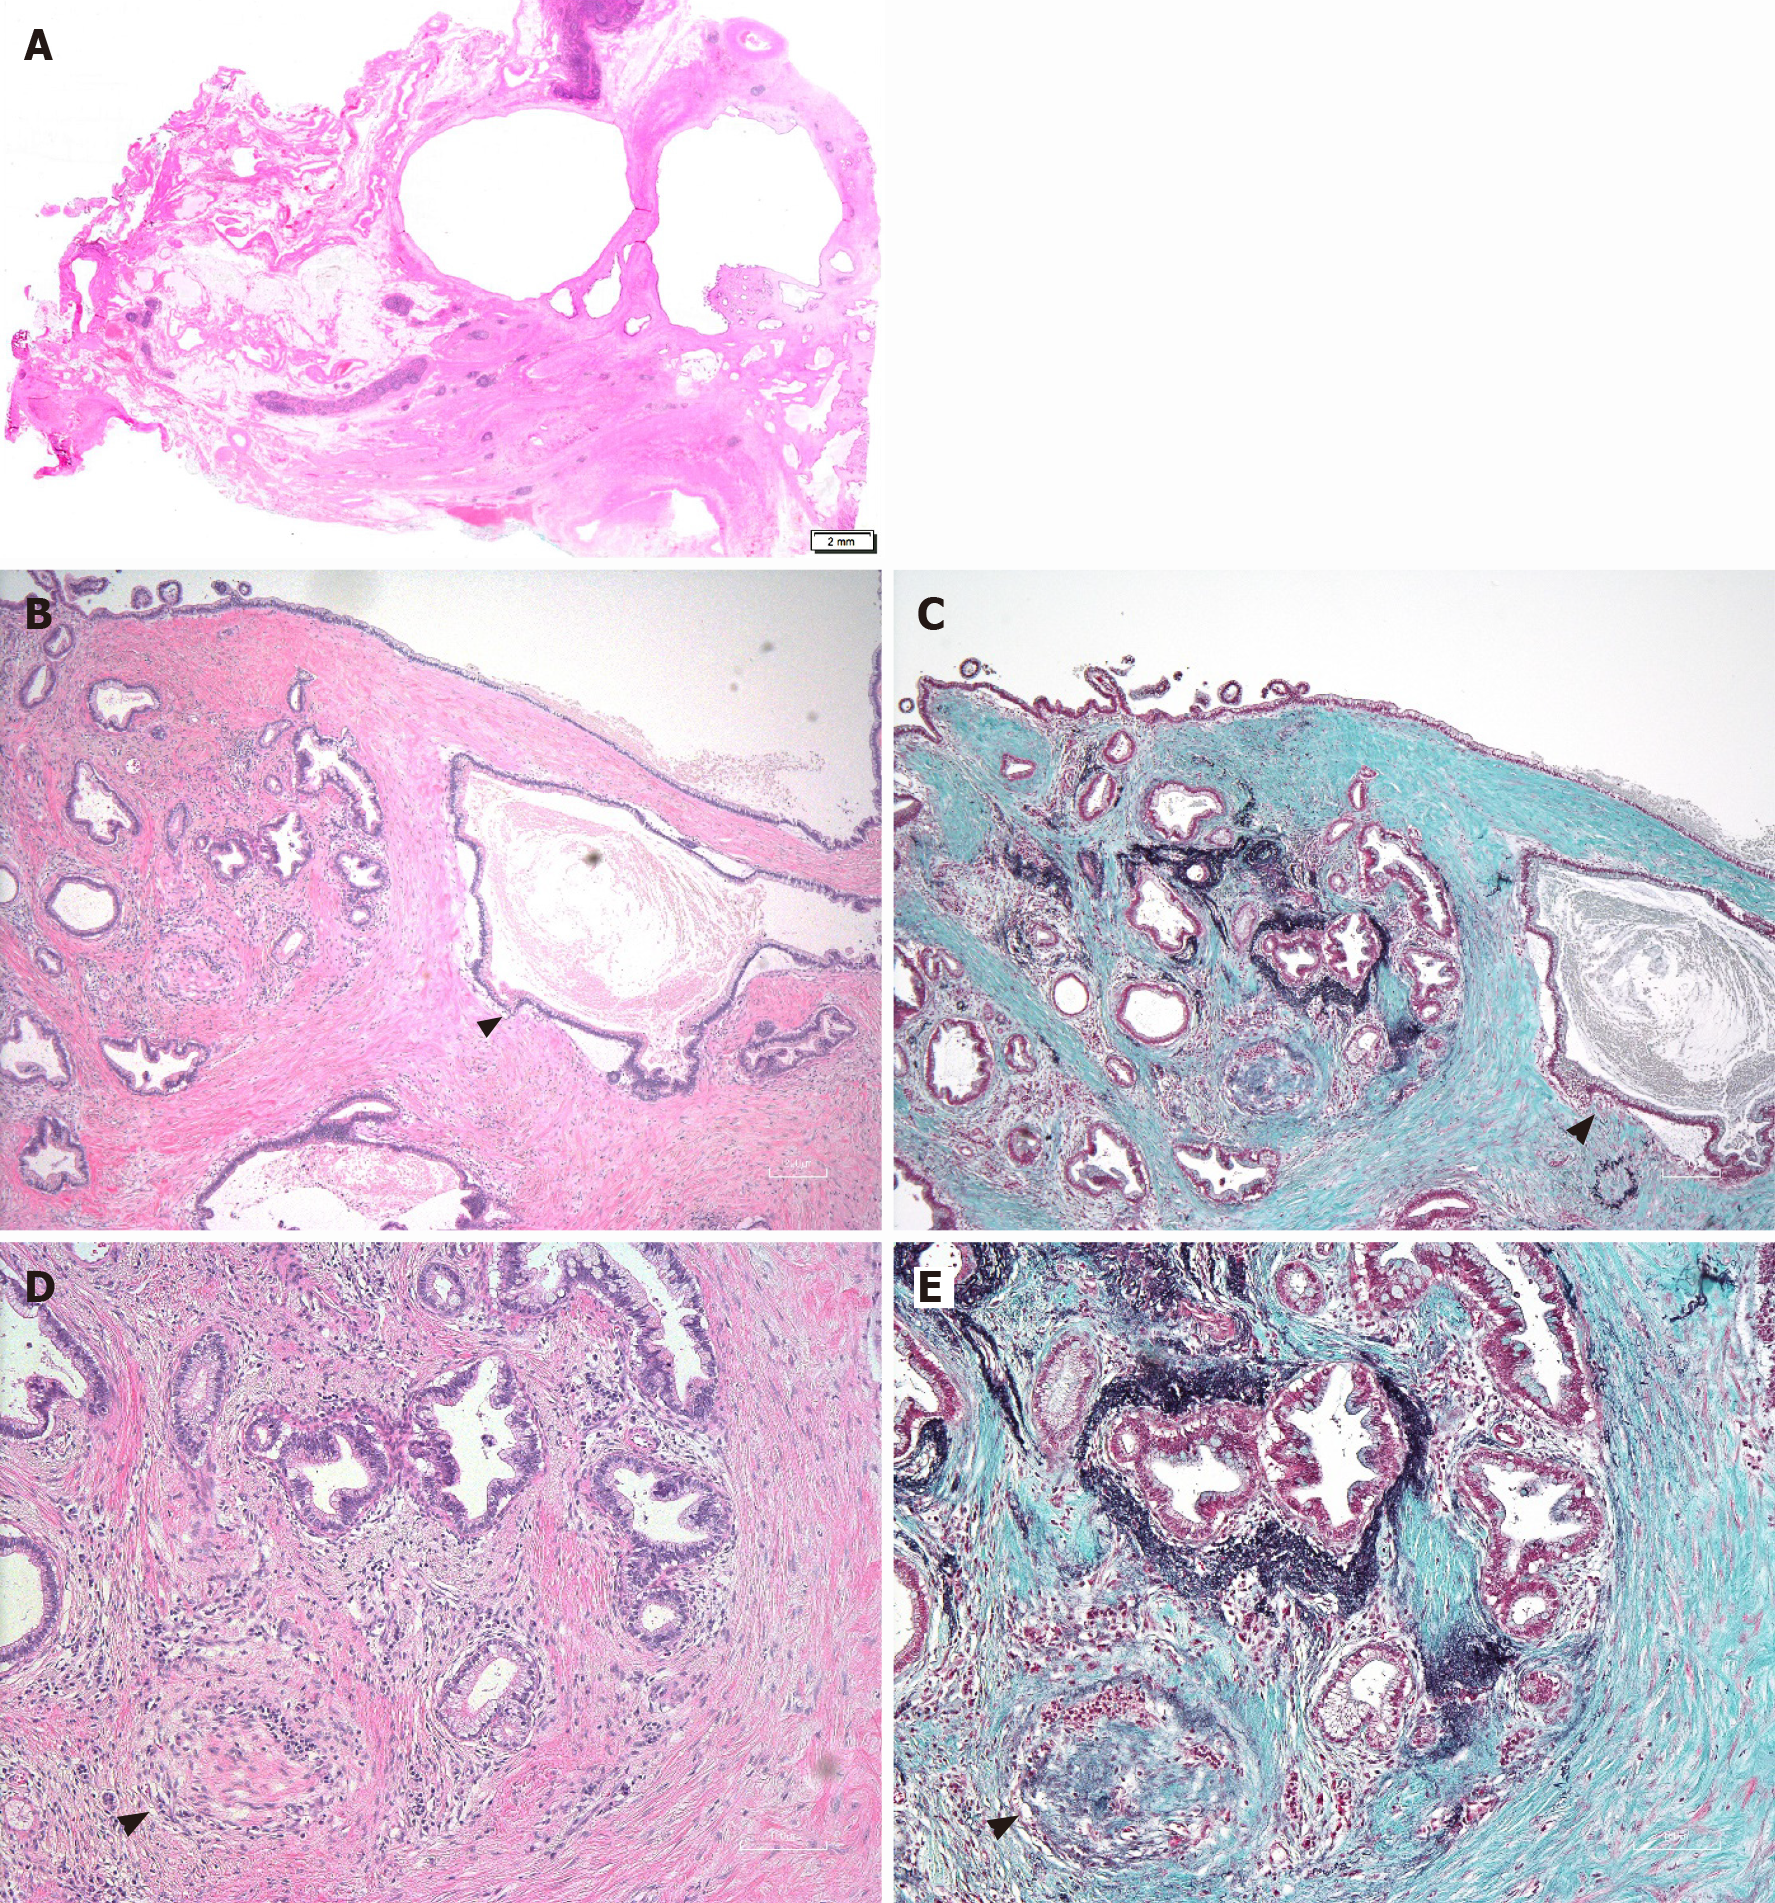
Figure 4 Pathological findings of large-duct pancreatic ductal adenocarcinoma.
A: Hematoxylin–eosin (HE) staining of the lesion (× 4); B: HE staining of the lesion (× 200) shows a dilatated glandular carcinoma > 0.5 mm in diameter (black arrowhead); C: Elastica–Masson immunohistochemistry (× 200) reveals that the dilatated glands lack elastic fibers (black arrowhead); D: HE staining of the carcinoma invading the myelin sheath (× 200; black arrowhead); E: Elastica–Masson immunohistochemistry (× 200) reveals that the dilatated glands invading the myelin sheath lack elastic fibers (black arrowheads show the myelin fiber).
- Citation: Sato H, Liss AS, Mizukami Y. Large-duct pattern invasive adenocarcinoma of the pancreas–a variant mimicking pancreatic cystic neoplasms: A minireview. World J Gastroenterol 2021; 27(23): 3262-3278
- URL: https://www.wjgnet.com/1007-9327/full/v27/i23/3262.htm
- DOI: https://dx.doi.org/10.3748/wjg.v27.i23.3262


