Copyright
©The Author(s) 2021.
World J Gastroenterol. Apr 14, 2021; 27(14): 1465-1482
Published online Apr 14, 2021. doi: 10.3748/wjg.v27.i14.1465
Published online Apr 14, 2021. doi: 10.3748/wjg.v27.i14.1465
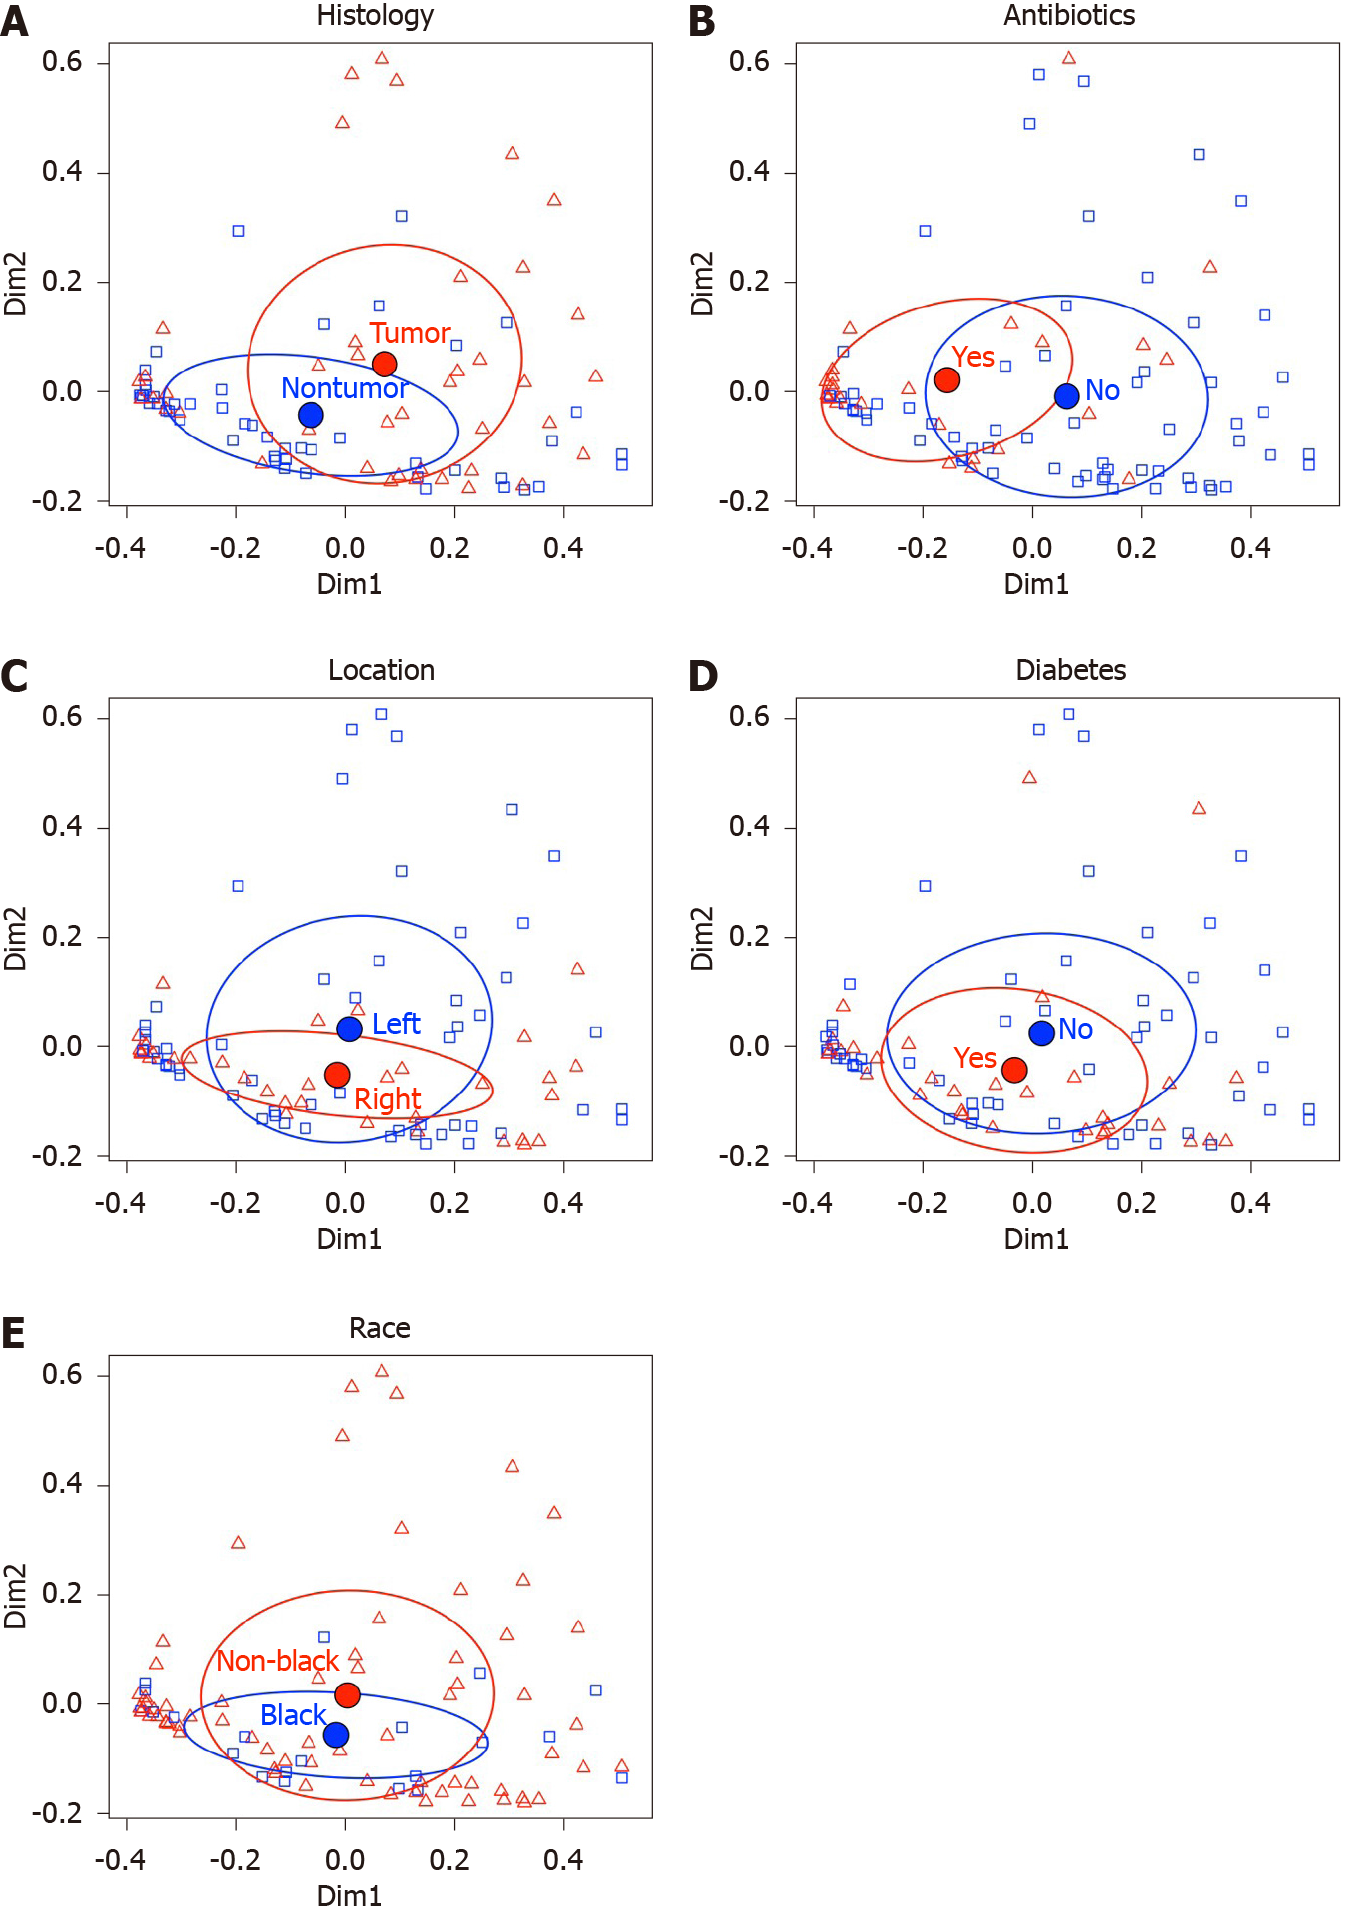
Figure 1 Principal coordinate analysis plots for Morita Horn dissimilarity indices.
A: Preoperative antibiotic treatment (yes/no); B: Tumor vs nontumor histology; C: Anatomic location of sample (left vs right); D: Diabetes mellitus status (yes/no); E: Black/African Ancestry race (yes/no). The filled circles and surrounding ovals indicate the mean ± SD centroid for each group.
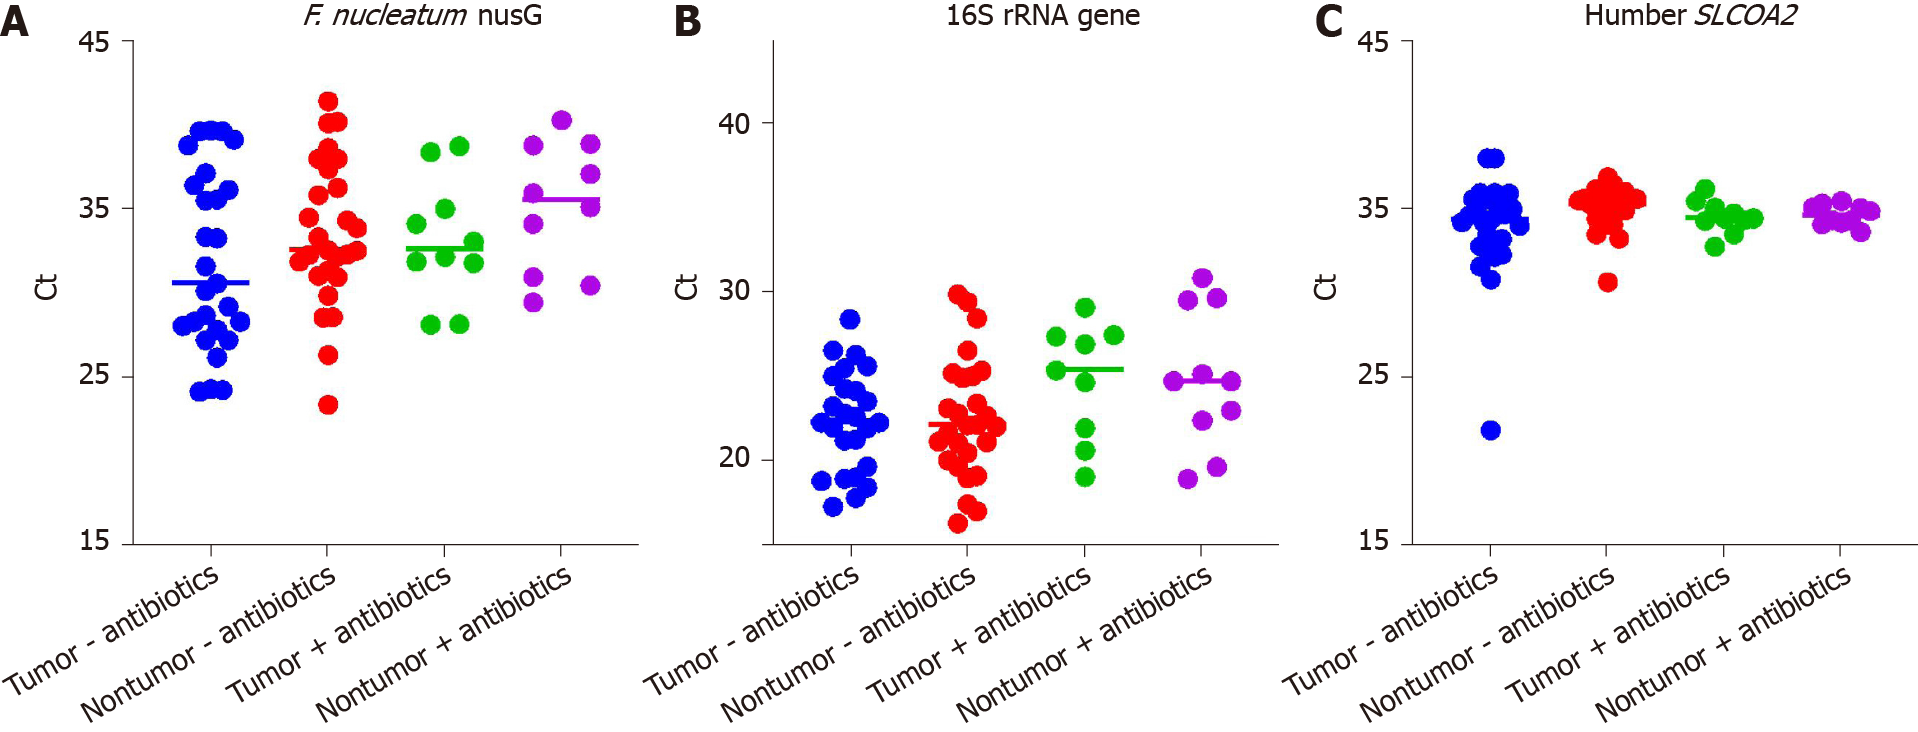
Figure 2 Scatter plots of threshold cycle values.
A: Fusobacterium nucleatum nusG gene; B: Broad range 16S rRNA gene; C: Human SLCOA2 gene quantitative polymerase chain reaction assays. F. nucleatum: Fusobacterium nucleatum.
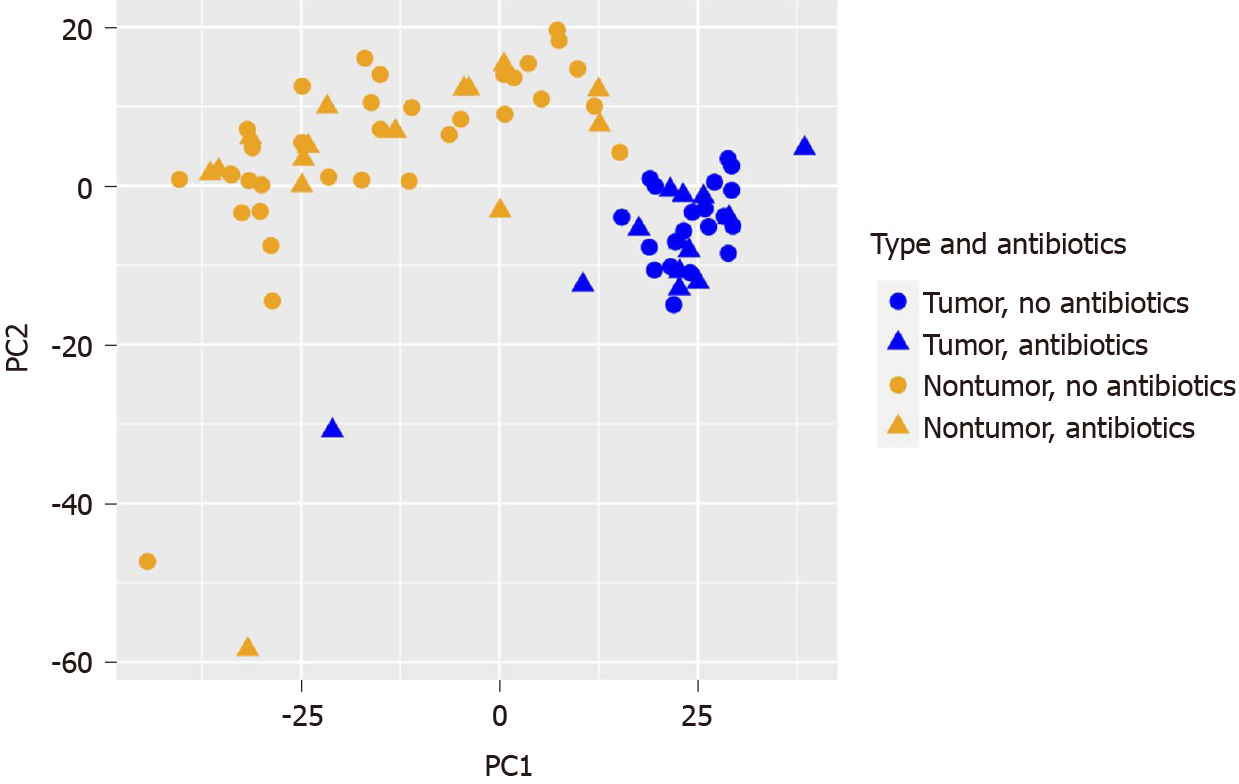
Figure 3
Principal coordinate analysis of human colorectal cancer RNA-seq data with respect to tumor histology (tumor vs nontumor) and preoperative antibiotics (yes/no).
- Citation: Malik SA, Zhu C, Li J, LaComb JF, Denoya PI, Kravets I, Miller JD, Yang J, Kramer M, McCombie WR, Robertson CE, Frank DN, Li E. Impact of preoperative antibiotics and other variables on integrated microbiome-host transcriptomic data generated from colorectal cancer resections. World J Gastroenterol 2021; 27(14): 1465-1482
- URL: https://www.wjgnet.com/1007-9327/full/v27/i14/1465.htm
- DOI: https://dx.doi.org/10.3748/wjg.v27.i14.1465


