Copyright
©The Author(s) 2020.
World J Gastroenterol. Dec 21, 2020; 26(47): 7513-7527
Published online Dec 21, 2020. doi: 10.3748/wjg.v26.i47.7513
Published online Dec 21, 2020. doi: 10.3748/wjg.v26.i47.7513
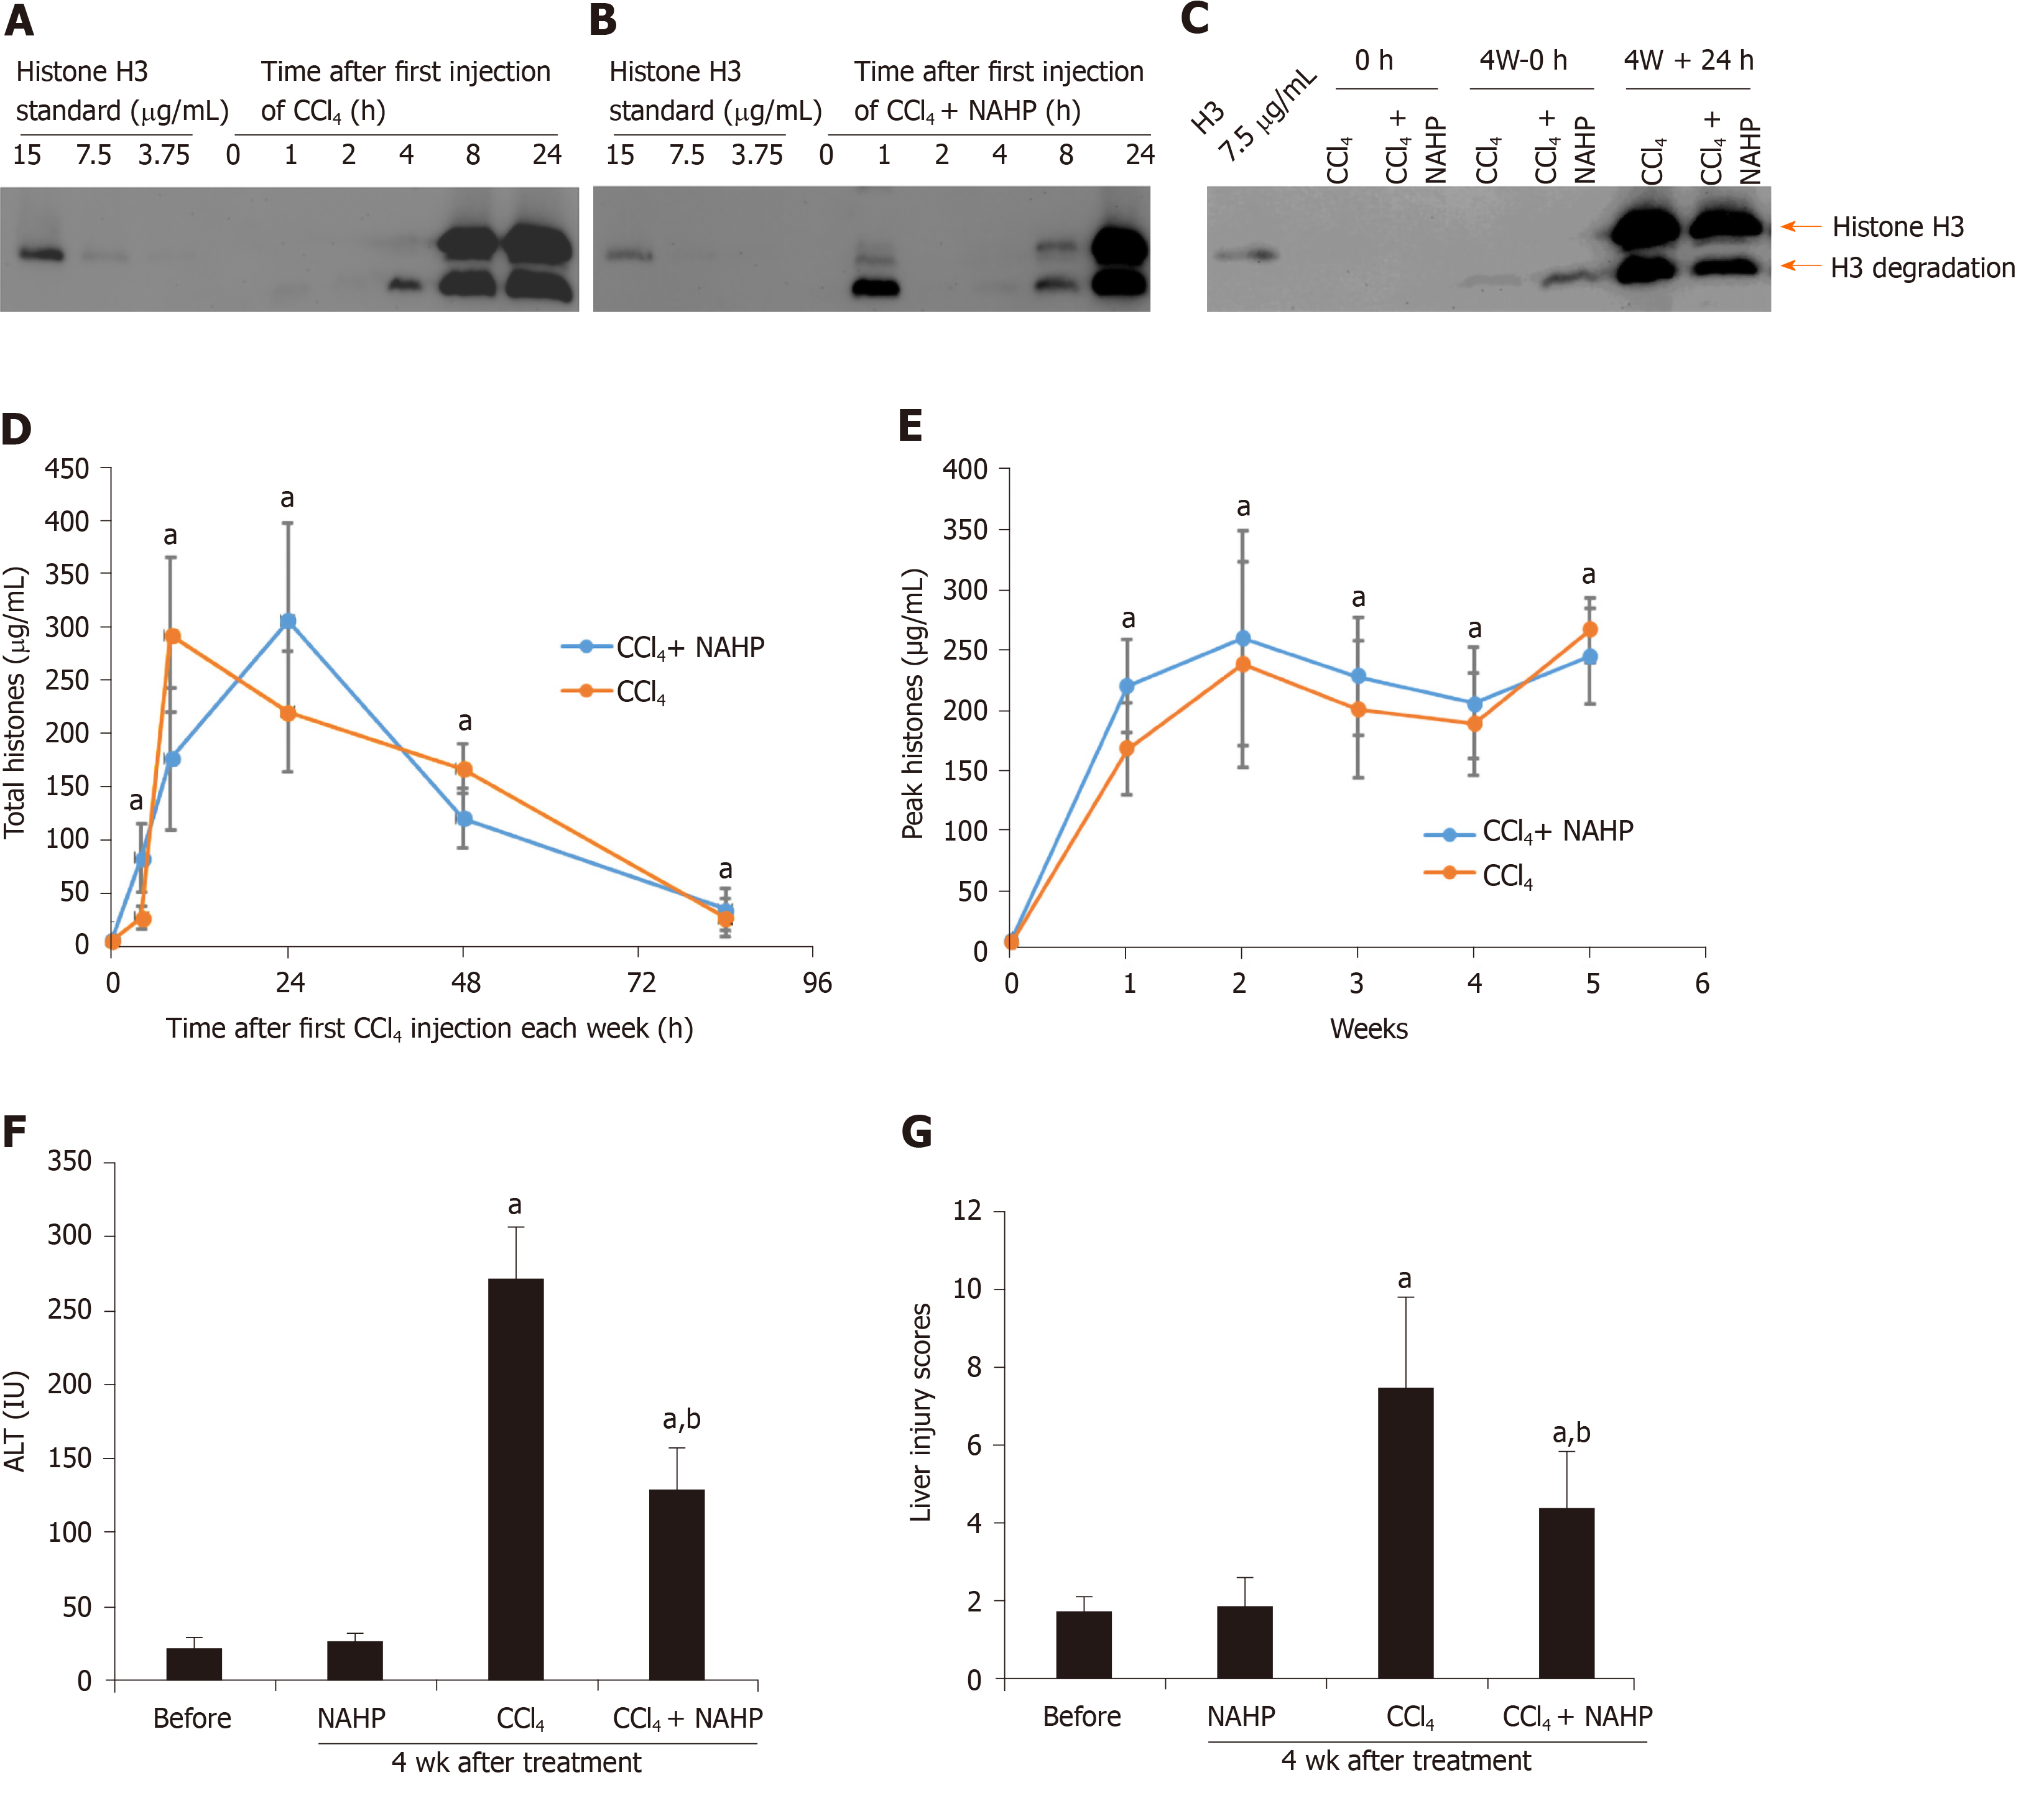
Figure 1 Circulating histones are elevated in ICR mice treated with CCl4.
Typical western blots of histone H3 standard and histone H3 in plasma from mice treated with the first dose of CCl4 (A) and CCl4 + non-anticoagulant heparin (NAHP) (B), and a typical H3 blot before and 24 h after the last dose of CCl4 (C); D: The mean ± SD of circulating histones at different time points, including 0 h (before the experiment), and 4, 8, 24, 48 and 84 h after first dose of CCl4 (orange) and CCl4 + NAHP (blue) of each week are presented. ANOVA test, aP < 0.05 compared to time 0; E: The mean ± SD of peak circulating histones (8 and 24 h after first CCl4 injection of each week). ANOVA test, aP < 0.05 compared to time 0 (before first injection). The mean ± SE of blood alanine aminotransferase levels (F) and liver injury scores (G) from nine mice in each group following 4 wk of treatment. ANOVA test, aP < 0.05 compared to mice without treatment (before). bP < 0.05 compared to CCl4 group. ANOVA: Analysis of variance; NAHP: Non-anticoagulant heparin; ALT: Alanine aminotransferase.
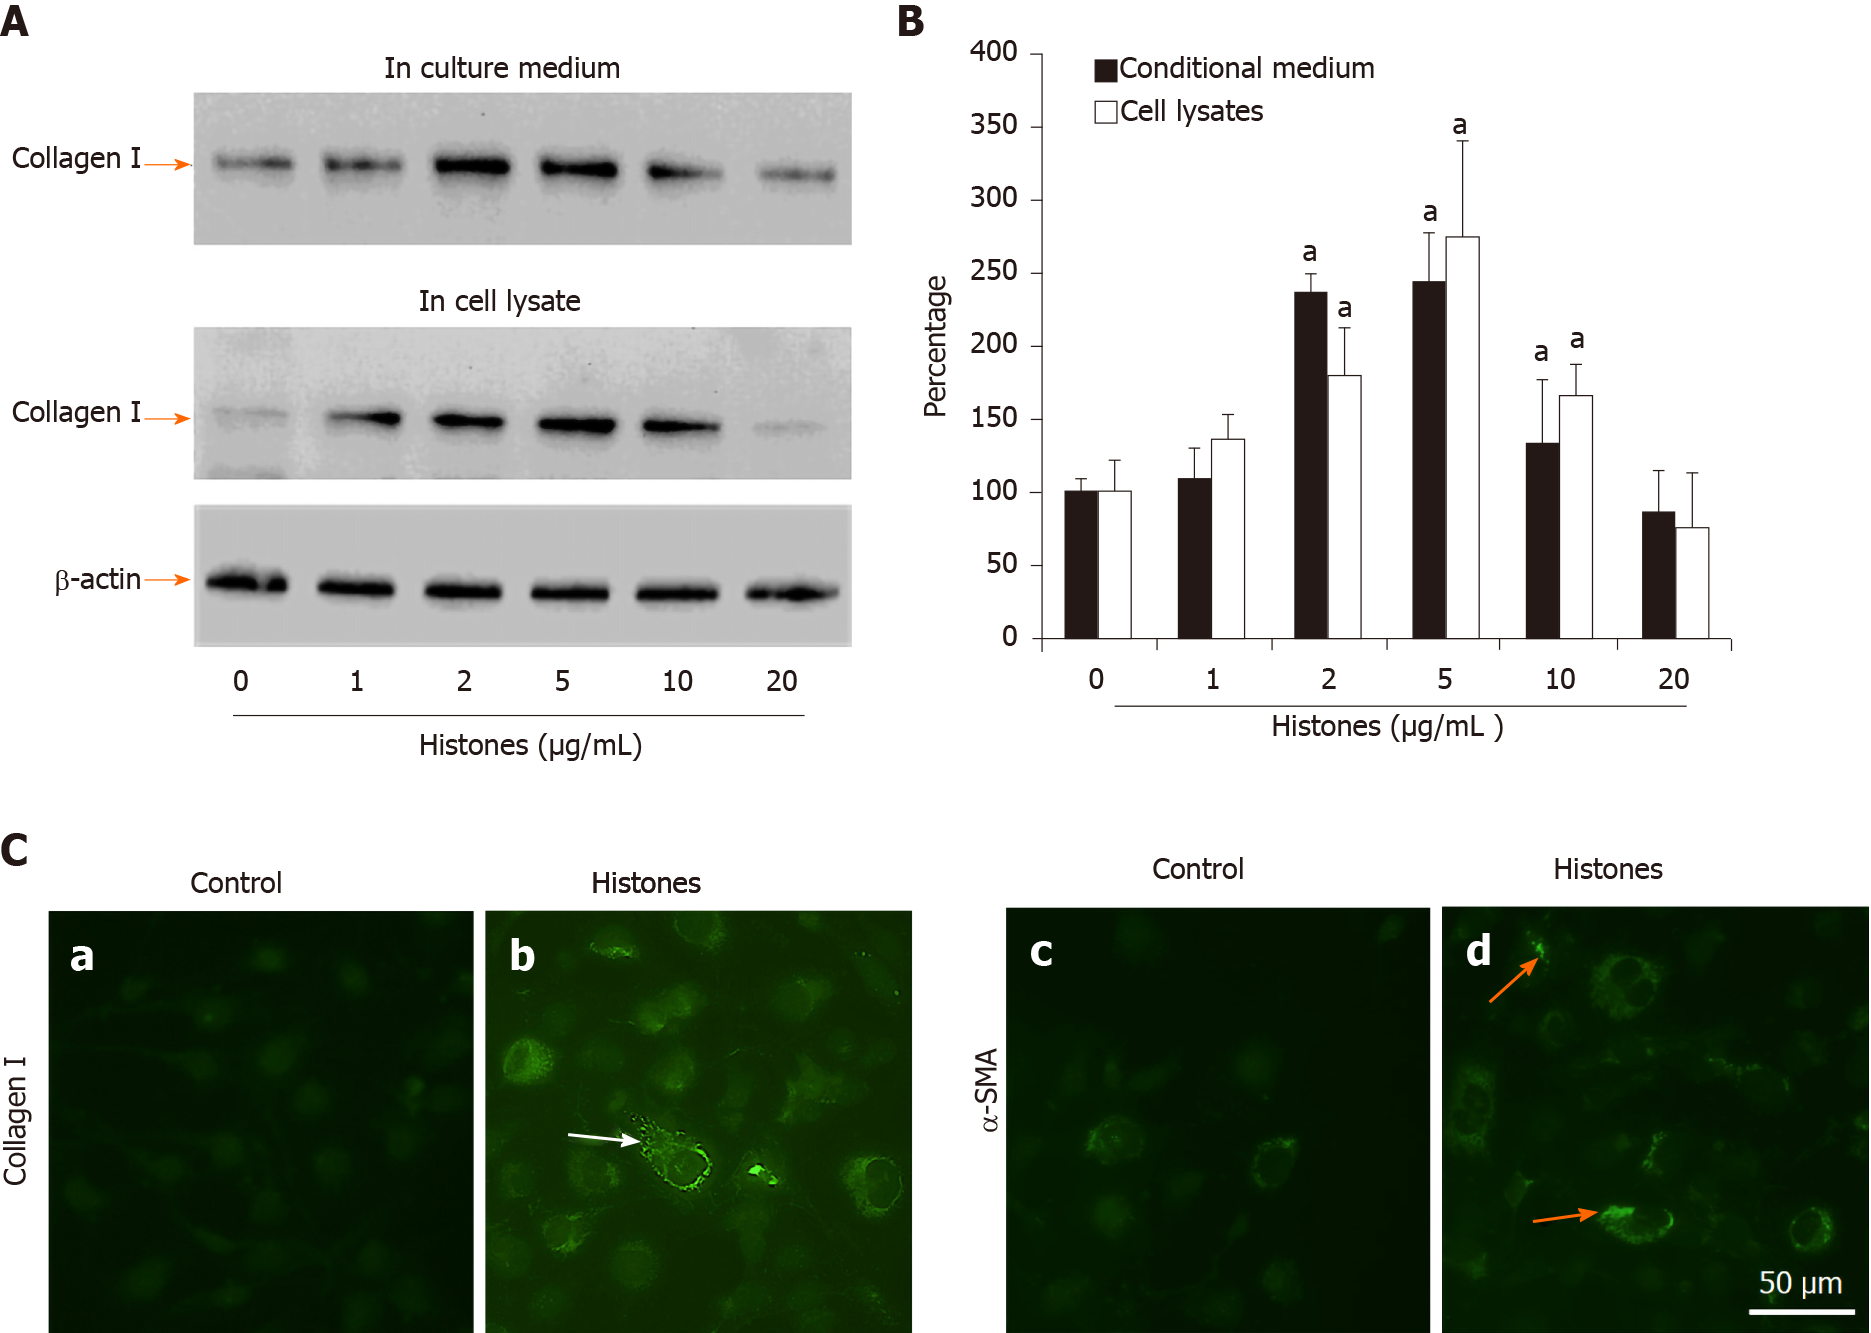
Figure 2 Extracellular histones induced collagen I and α-smooth muscle actin production in LX2 cells.
A: Typical western blots of collagen I in medium (upper panel) and lysates (middle panel) of LX2 cells treated with different concentrations of histones at day 6. Lower panel: β-actin in the cell lysates; B: The mean ± SD of the relative percentages of collagen/β-actin ratios with untreated LX2 cells set at 100% from five independent experiments. Analysis of variance test, aP < 0.05 compared to untreated cells; C: Immunofluorescent staining of LX2 cells with anti-collagen I and anti-α- smooth muscle actin (SMA) antibodies. Control: Cells were treated with culture medium without histones for 6 d. Histones: Cells were treated with culture medium + 5 μg/mL histones. Typical images are shown. White arrows indicate staining for collagen I, orange arrows indicate staining for α-SMA. Bar = 50 m. α-SMA: α-smooth muscle actin.
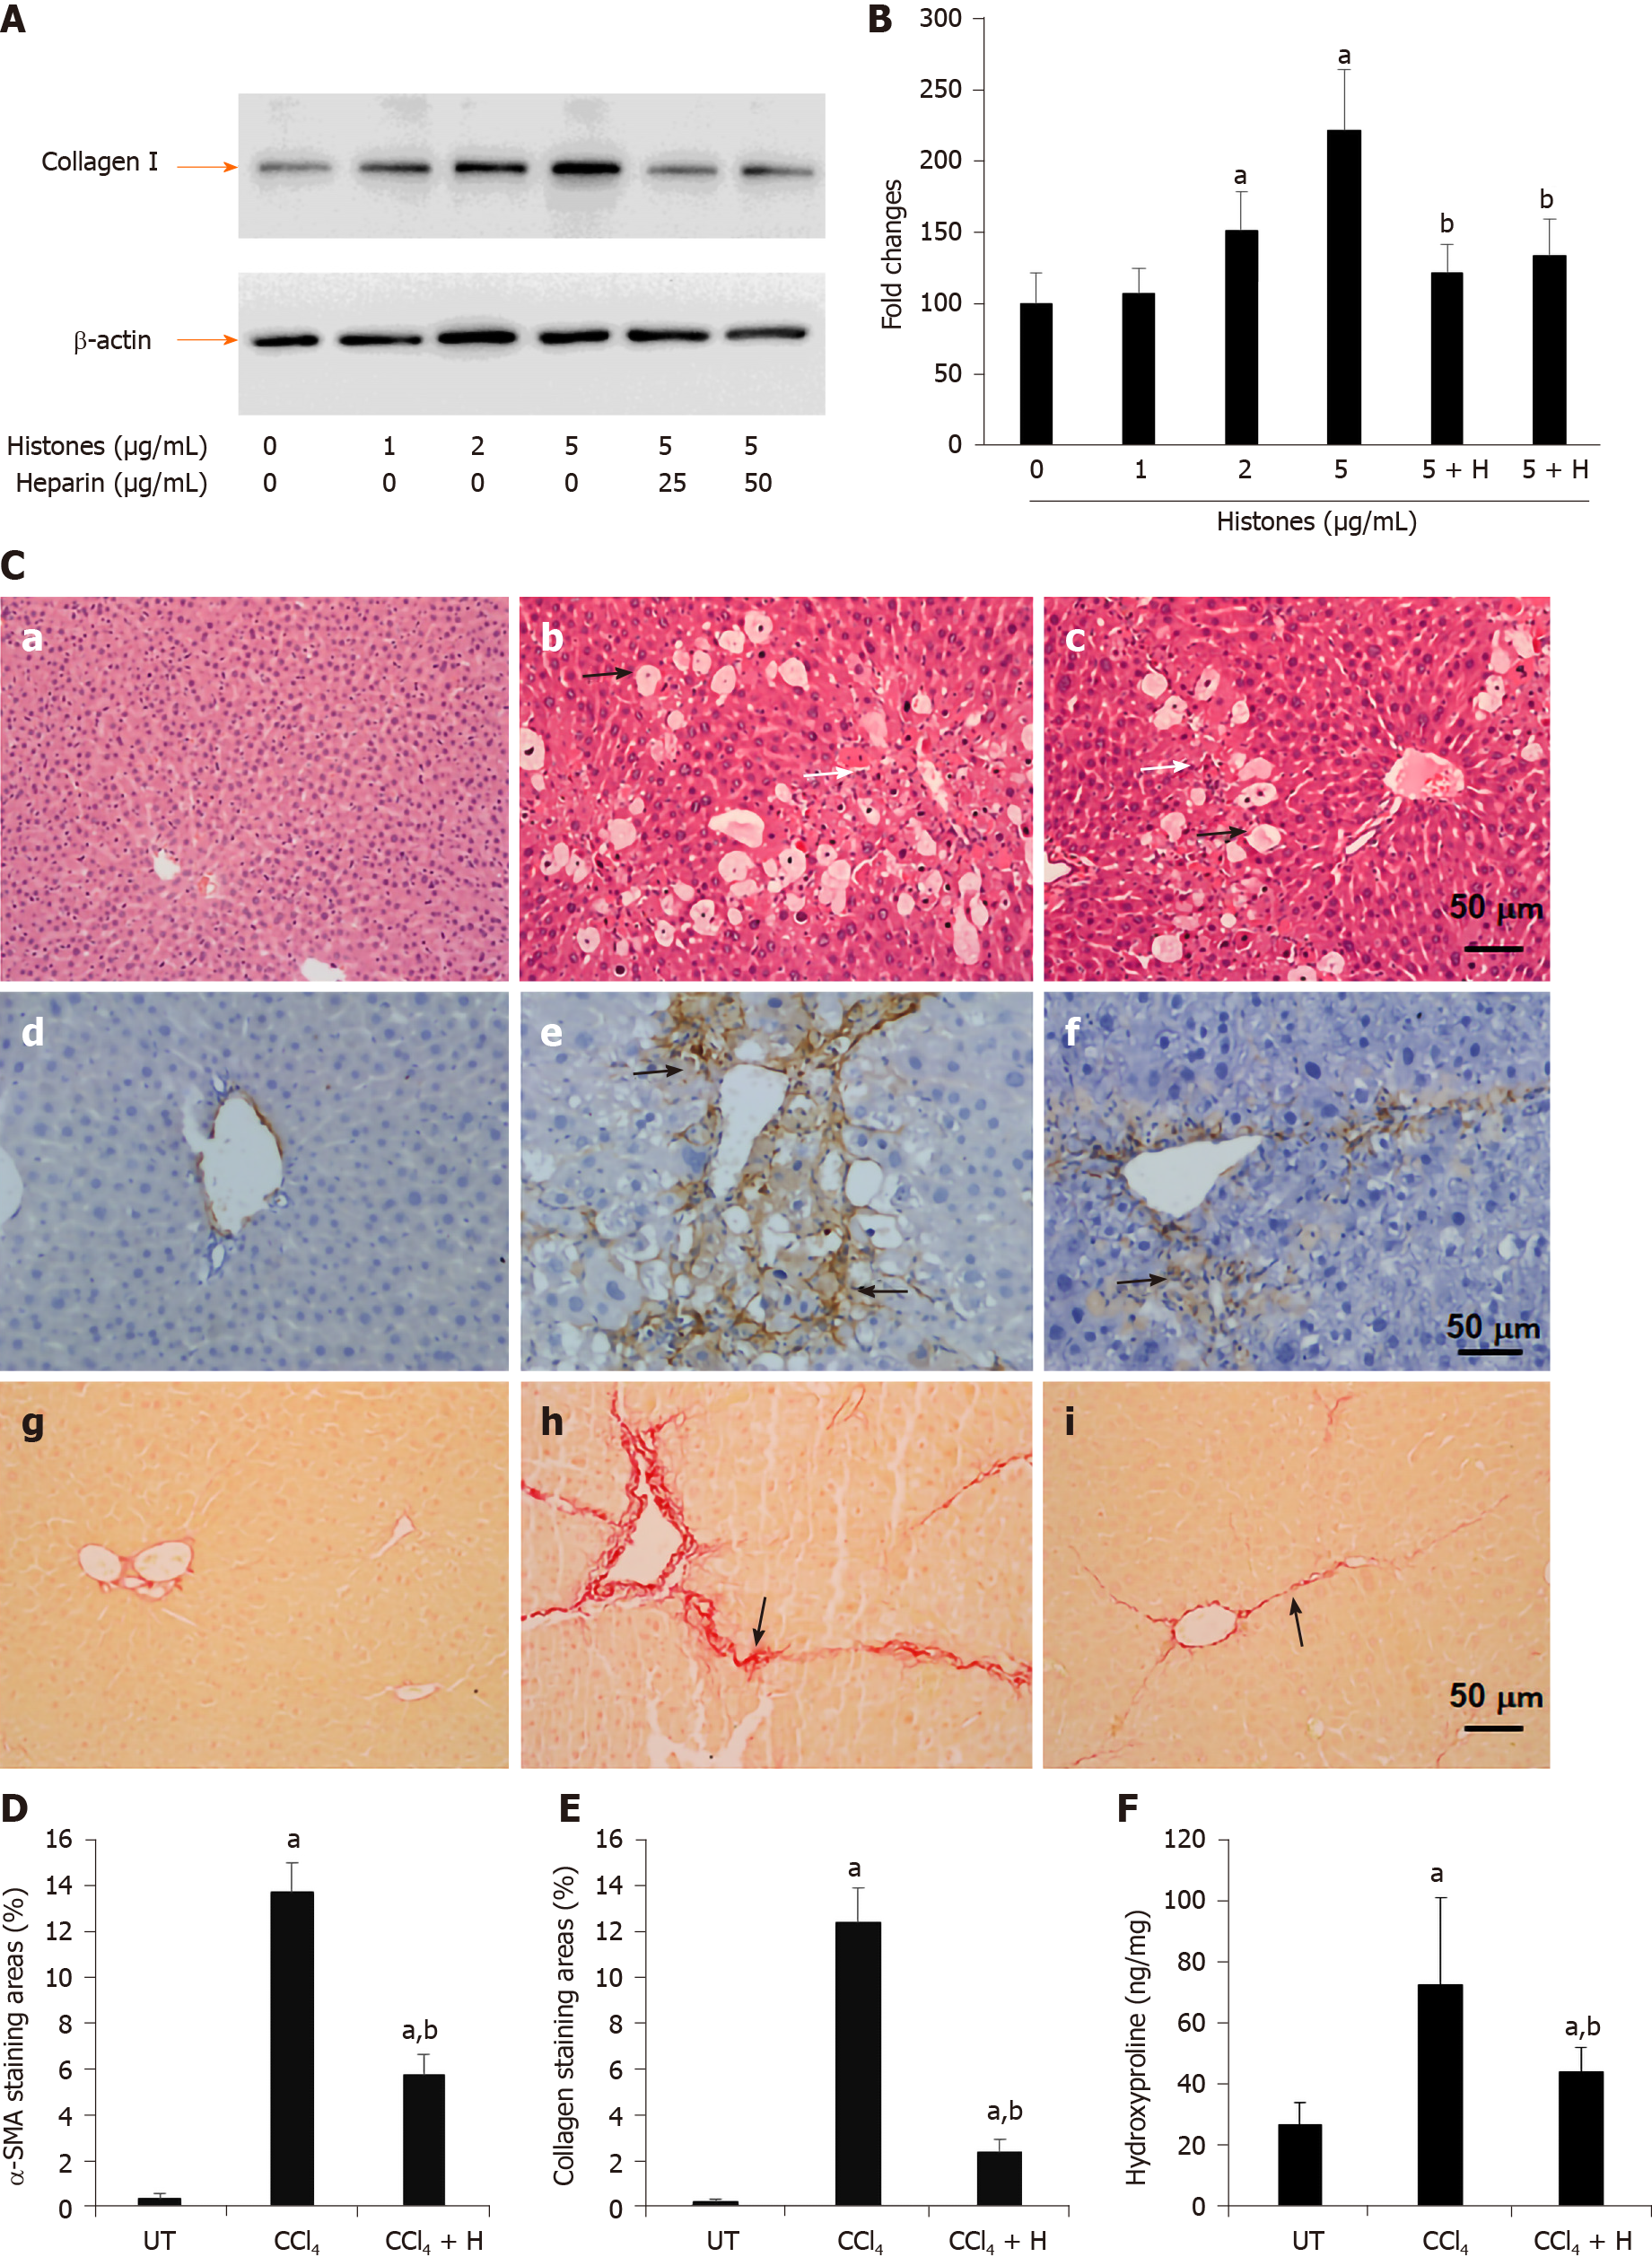
Figure 3 Effect of anti-histone reagent, non-anticoagulant heparin, on histone-enhanced collagen I production in LX2 cells and CCl4-induced fibrosis in mice.
A: Typical western blots of collagen I in LX2 cells treated with histones or histones + non-anticoagulant heparin (NAHP). Beta-actin is shown as a loading reference; B: The mean ± SD of relative percentage of collagen/actin ratios in untreated LX-2 cells set at 100% from three independent experiments. ANOVA test, aP < 0.05 compared to untreated cells. bP < 0.05 compared to cells treated with 5 μg/mL histones; C: Typical images of stained liver sections (hematoxylin and eosin staining: a-c; immunohistochemical staining with anti-α-SMA: d-f; and Sirius red staining: g-i) from normal mice (a, d, g); mice treated with CCl4 (b, e, h) and mice treated with CCl4 + NAHP (CCl4 + H) (c, f, i). Arrows in b and c: Black indicate hepatocyte swelling and white indicate necrosis and immune cell infiltration. Arrows in e and f: Indicate staining for smooth muscle actin. Arrows in h and i: Indicate collagen deposition. The mean ± SD of percentage of areas of staining for α-SMA (D) and Sirius red staining for collagen (E) (nine mice per group, and six randomly selected sections per mouse). ANOVA test, aP < 0.05 compared to controls. bP < 0.05 compared to CCl4 alone; F: The mean ± SD of hydroxyproline levels in liver tissues from nine mice per group. ANOVA test, aP < 0.05 compared to controls. bP < 0.05 compared to CCl4 alone. α-SMA: α-smooth muscle actin; ANOVA: Analysis of variance; NAHP: Non-anticoagulant heparin.
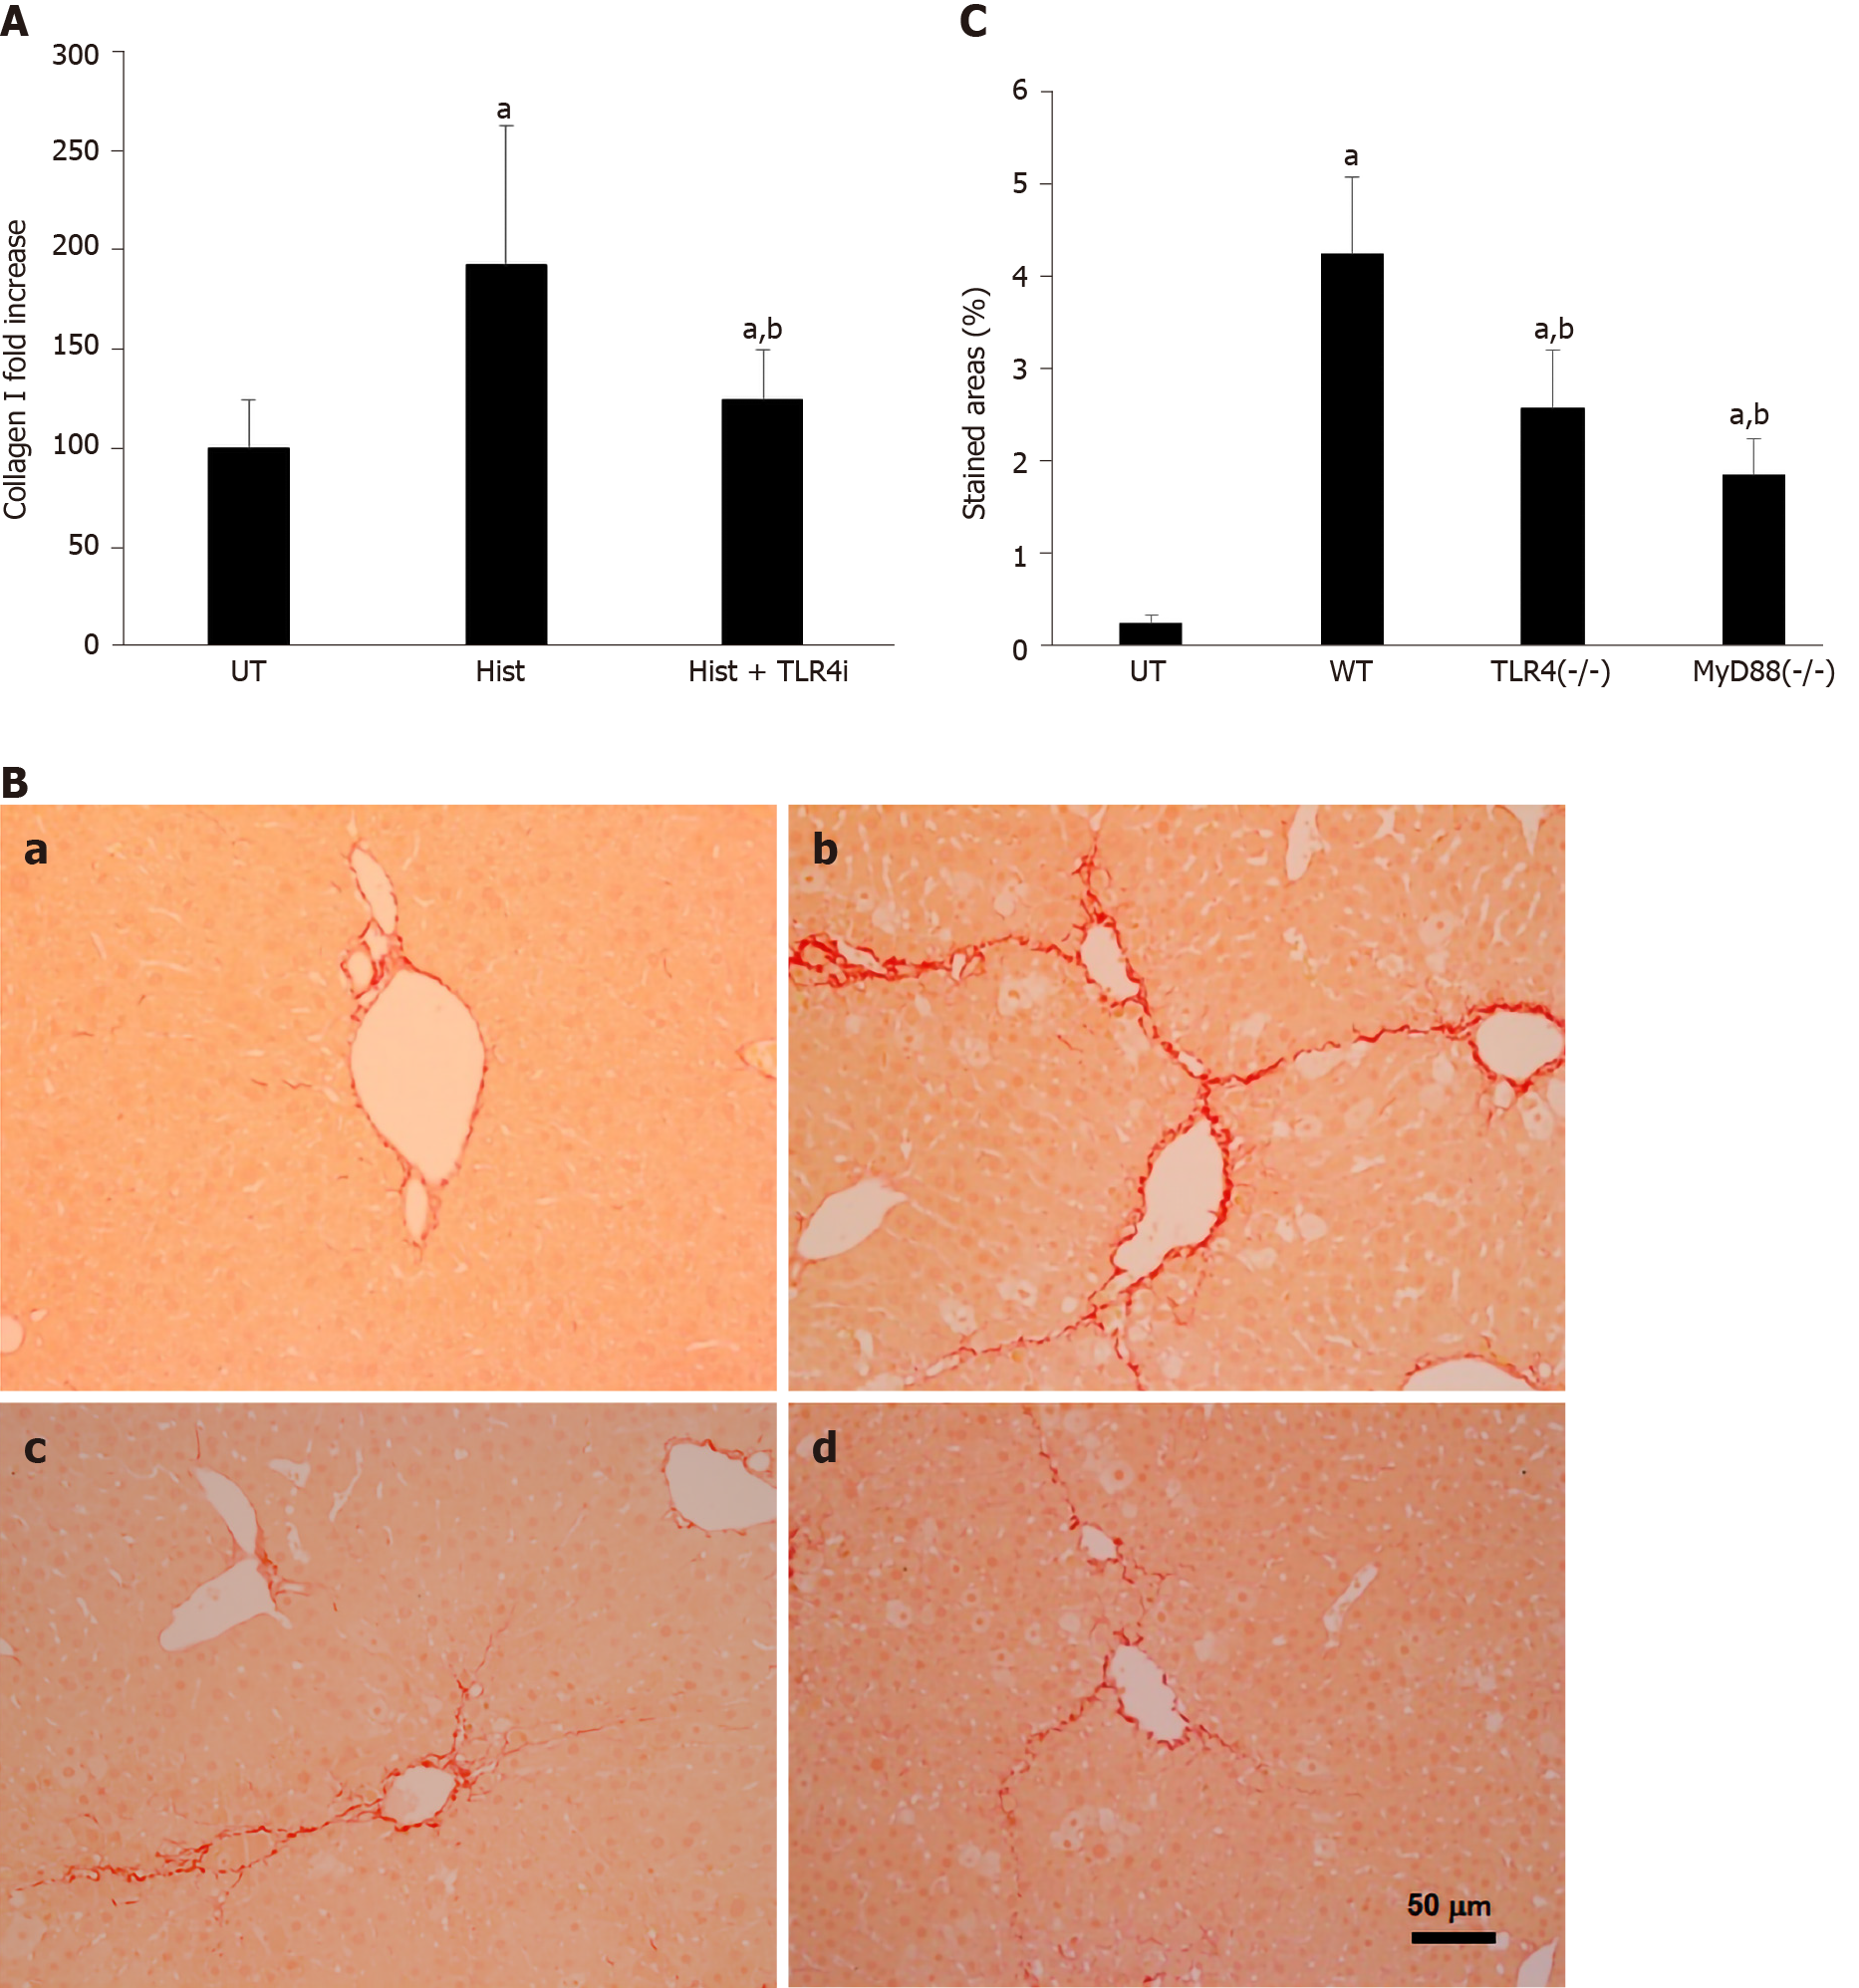
Figure 4 TLR4 is involved in histone-enhanced collagen I production and CCl4-induced mouse liver fibrosis.
A: LX2 cells were treated with 5 μg/mL histones (Hist) in the presence or absence of TLR4 neutralizing antibody (TLR4i). The mean ± SD of the relative percentage of collagen Ι/β-actin ratios are presented with control (UT) set at 100% from three independent experiments. ANOVA test, aP < 0.05 compared to UT. bP < 0.05 compared to histone alone; B: Typical images of Sirius red staining of liver section from untreated wt C57BL/6j mice (a), CCl4-treated wt mice (b), and TLR4 and MyD88 knockout mice; C: The mean ± SD of stained areas of liver sections from untreated wt mice (UT), CCl4-treated wt mice (WT), CCl4-treated TLR4-/- and MyD88-/- mice. Eight mice were in each group and six sections from each mouse were analyses. ANOVA test, aP < 0.05 compared to untreated wt mice (UT). bP < 0.05 compared to CCl4-treated wt mice. ANOVA: Analysis of variance; wt: Wild type; UT: Control.
- Citation: Wang Z, Cheng ZX, Abrams ST, Lin ZQ, Yates E, Yu Q, Yu WP, Chen PS, Toh CH, Wang GZ. Extracellular histones stimulate collagen expression in vitro and promote liver fibrogenesis in a mouse model via the TLR4-MyD88 signaling pathway. World J Gastroenterol 2020; 26(47): 7513-7527
- URL: https://www.wjgnet.com/1007-9327/full/v26/i47/7513.htm
- DOI: https://dx.doi.org/10.3748/wjg.v26.i47.7513


