Copyright
©The Author(s) 2020.
World J Gastroenterol. Nov 28, 2020; 26(44): 6963-6978
Published online Nov 28, 2020. doi: 10.3748/wjg.v26.i44.6963
Published online Nov 28, 2020. doi: 10.3748/wjg.v26.i44.6963
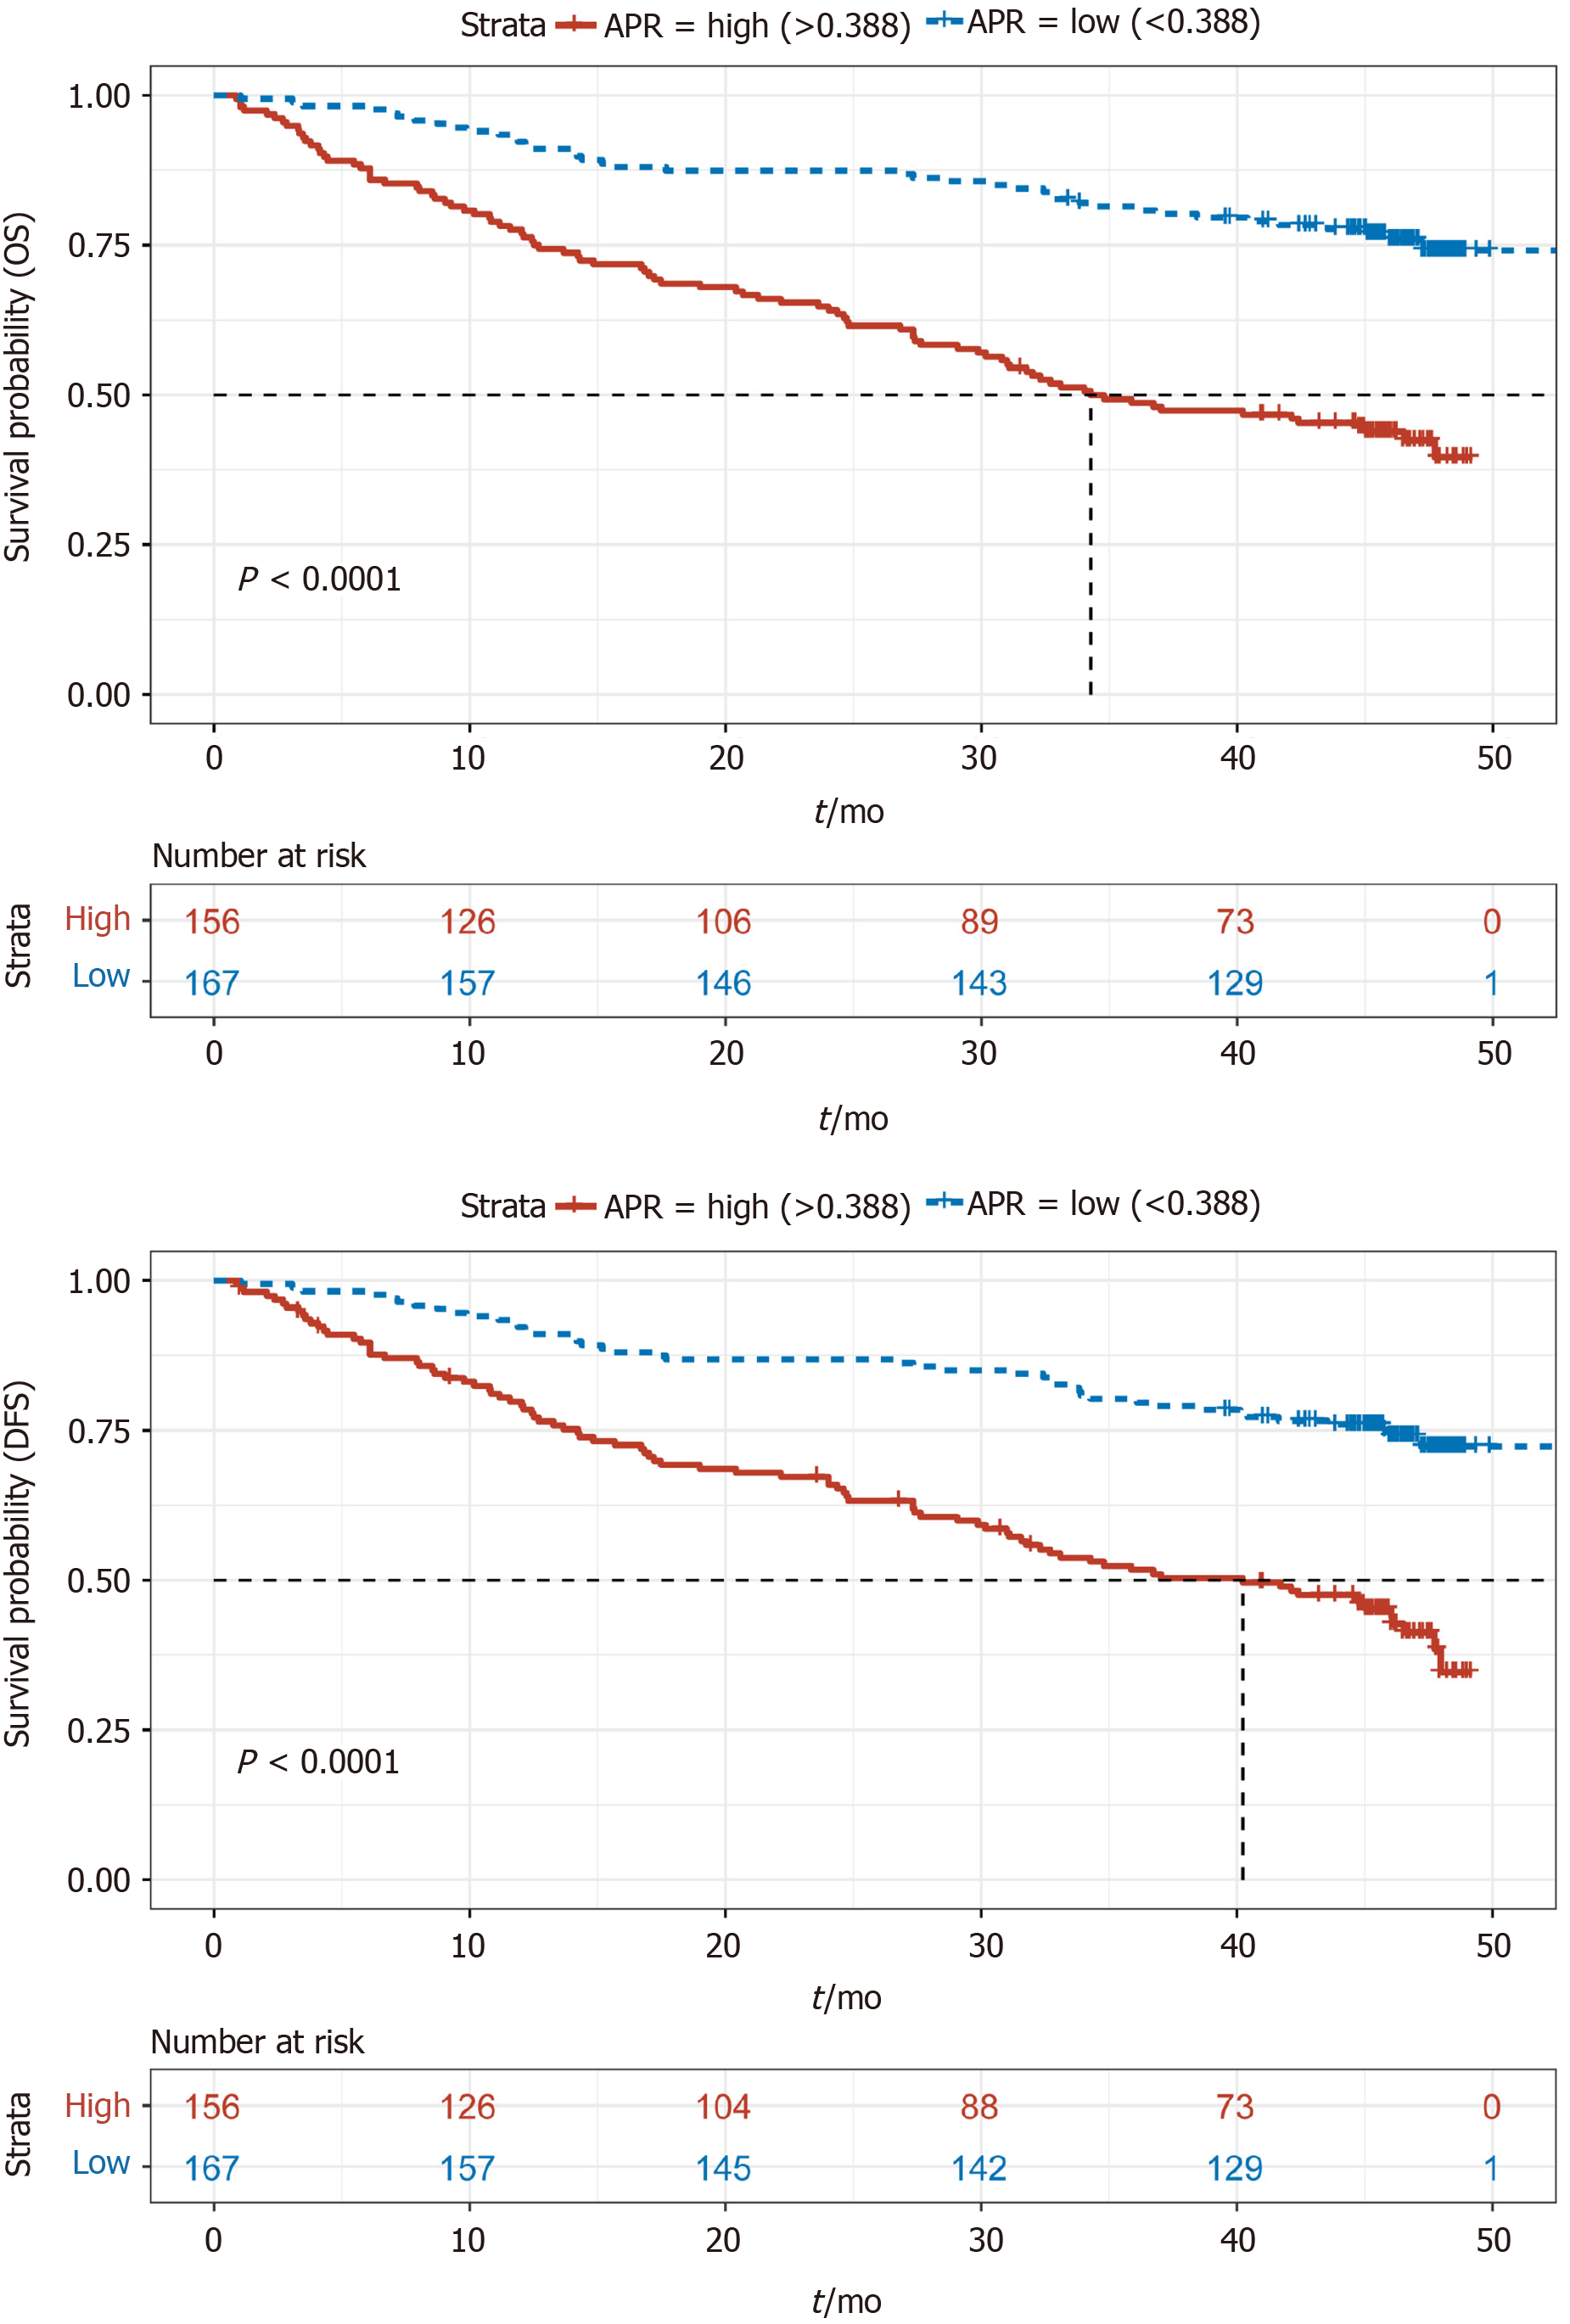
Figure 1 Comparison of overall survival and disease-free survival between the alkaline phosphatase to prealbumin ratio-low and -high groups.
APR: Alkaline phosphatase to prealbumin ratio.
Figure 2 Comparison of overall survival and disease-free survival between the two groups in terms of C-reactive protein to albumin ratio, neutrophil and lymphocyte ratio, platelet to lymphocyte ratio, and lymphocyte to monocyte ratio.
A: Comparison of overall survival (OS) and disease-free survival (DFS) between the C-reactive protein to albumin ratio (CAR)-low and CAR-high groups; B: Comparison of OS and DFS between the neutrophil and lymphocyte ratio (NLR)-low and NLR-high groups; C: Comparison of OS and DFS between the platelet to lymphocyte ratio (PLR)-low and PLR-high groups; D: Comparison of OS and DFS between the lymphocyte to monocyte ratio (LMR)-low and LMR-high groups. CAR: C-reactive protein to albumin ratio; NLR: Neutrophil and lymphocyte ratio; PLR: Platelet to lymphocyte ratio; LMR: Lymphocyte to monocyte ratio.
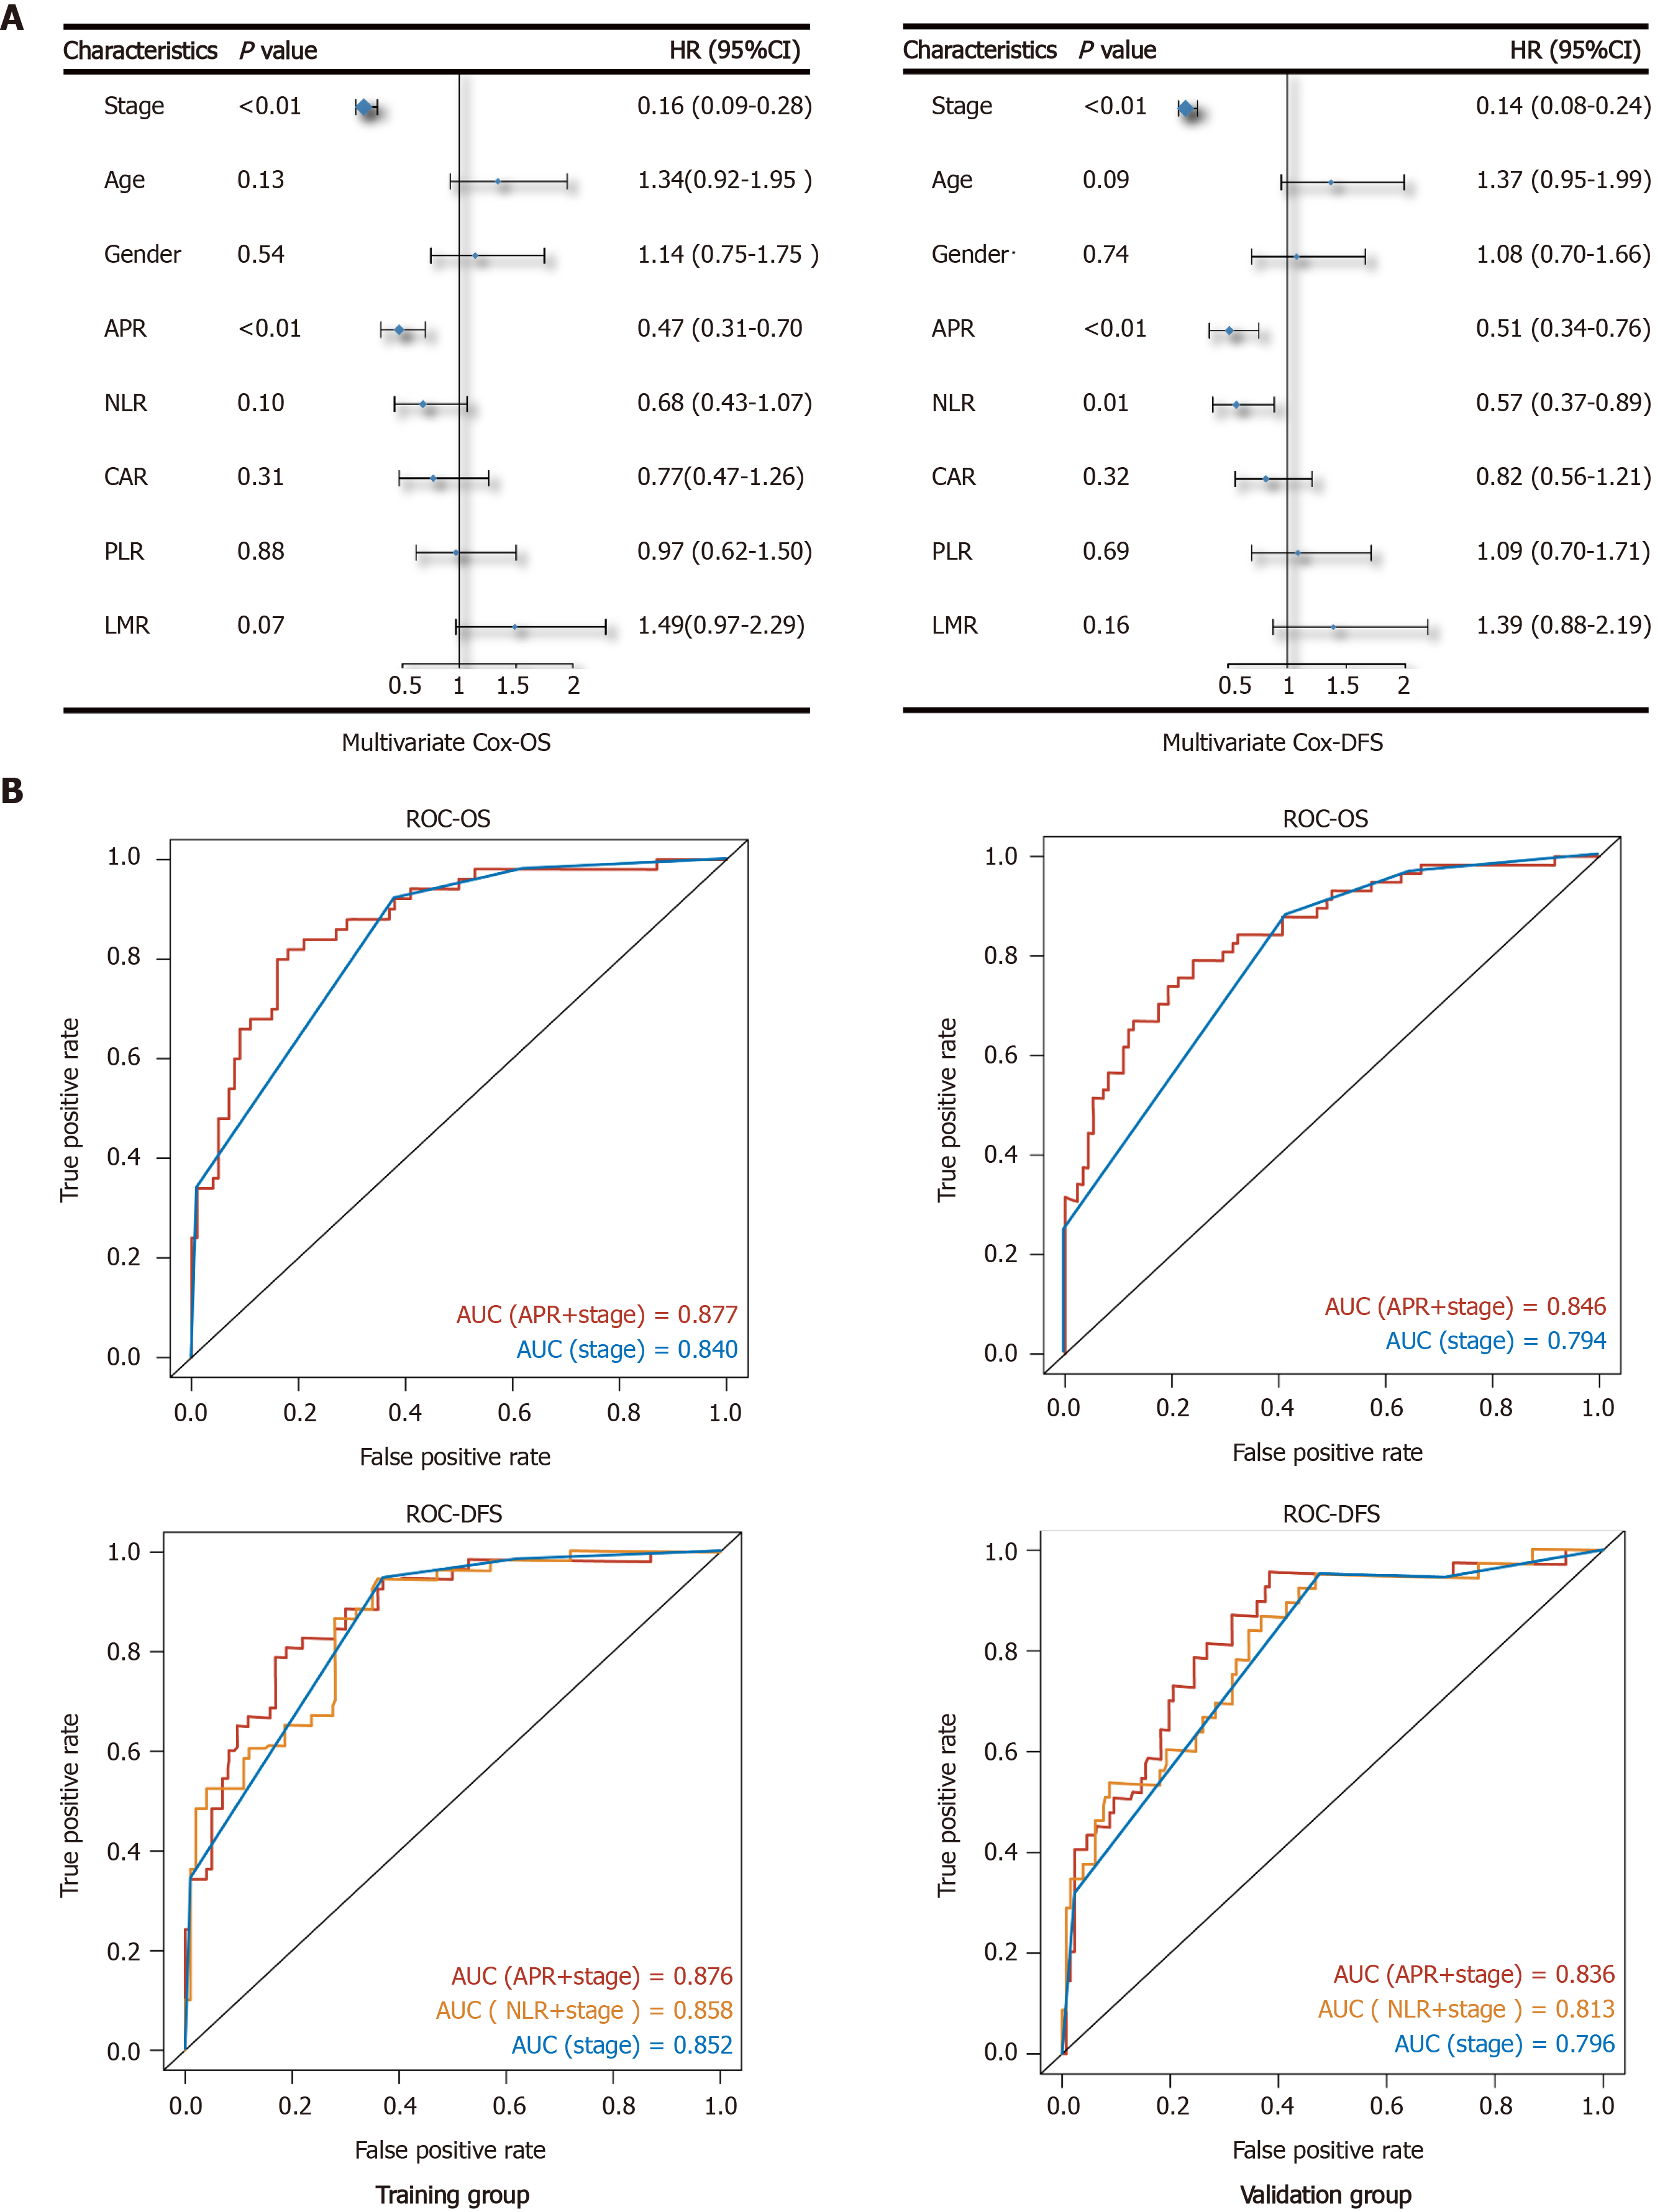
Figure 3 Multivariate Cox analysis and evaluating efficiency of indices.
A: Shows the results of multivariate Cox analysis of overall survival and disease-free survival by forest plot; B: Shows the comparison of evaluating efficiency among different Cox models. OS: Overall survival; DFS: Disease-free survival; AUC: Area under the curve; ROC: Receiver operating characteristic.
Figure 4 Survival status of the model estimated by stage and alkaline phosphatase to prealbumin ratio.
A: Risk score plot of training and validation groups; B: Status plot of training and validation groups; C: Receiver operating characteristic curve of the model in training and validation groups.
- Citation: Li Y, Wang JS, Guo Y, Zhang T, Li LP. Use of the alkaline phosphatase to prealbumin ratio as an independent predictive factor for the prognosis of gastric cancer. World J Gastroenterol 2020; 26(44): 6963-6978
- URL: https://www.wjgnet.com/1007-9327/full/v26/i44/6963.htm
- DOI: https://dx.doi.org/10.3748/wjg.v26.i44.6963


