Copyright
©The Author(s) 2020.
World J Gastroenterol. Apr 28, 2020; 26(16): 1912-1925
Published online Apr 28, 2020. doi: 10.3748/wjg.v26.i16.1912
Published online Apr 28, 2020. doi: 10.3748/wjg.v26.i16.1912
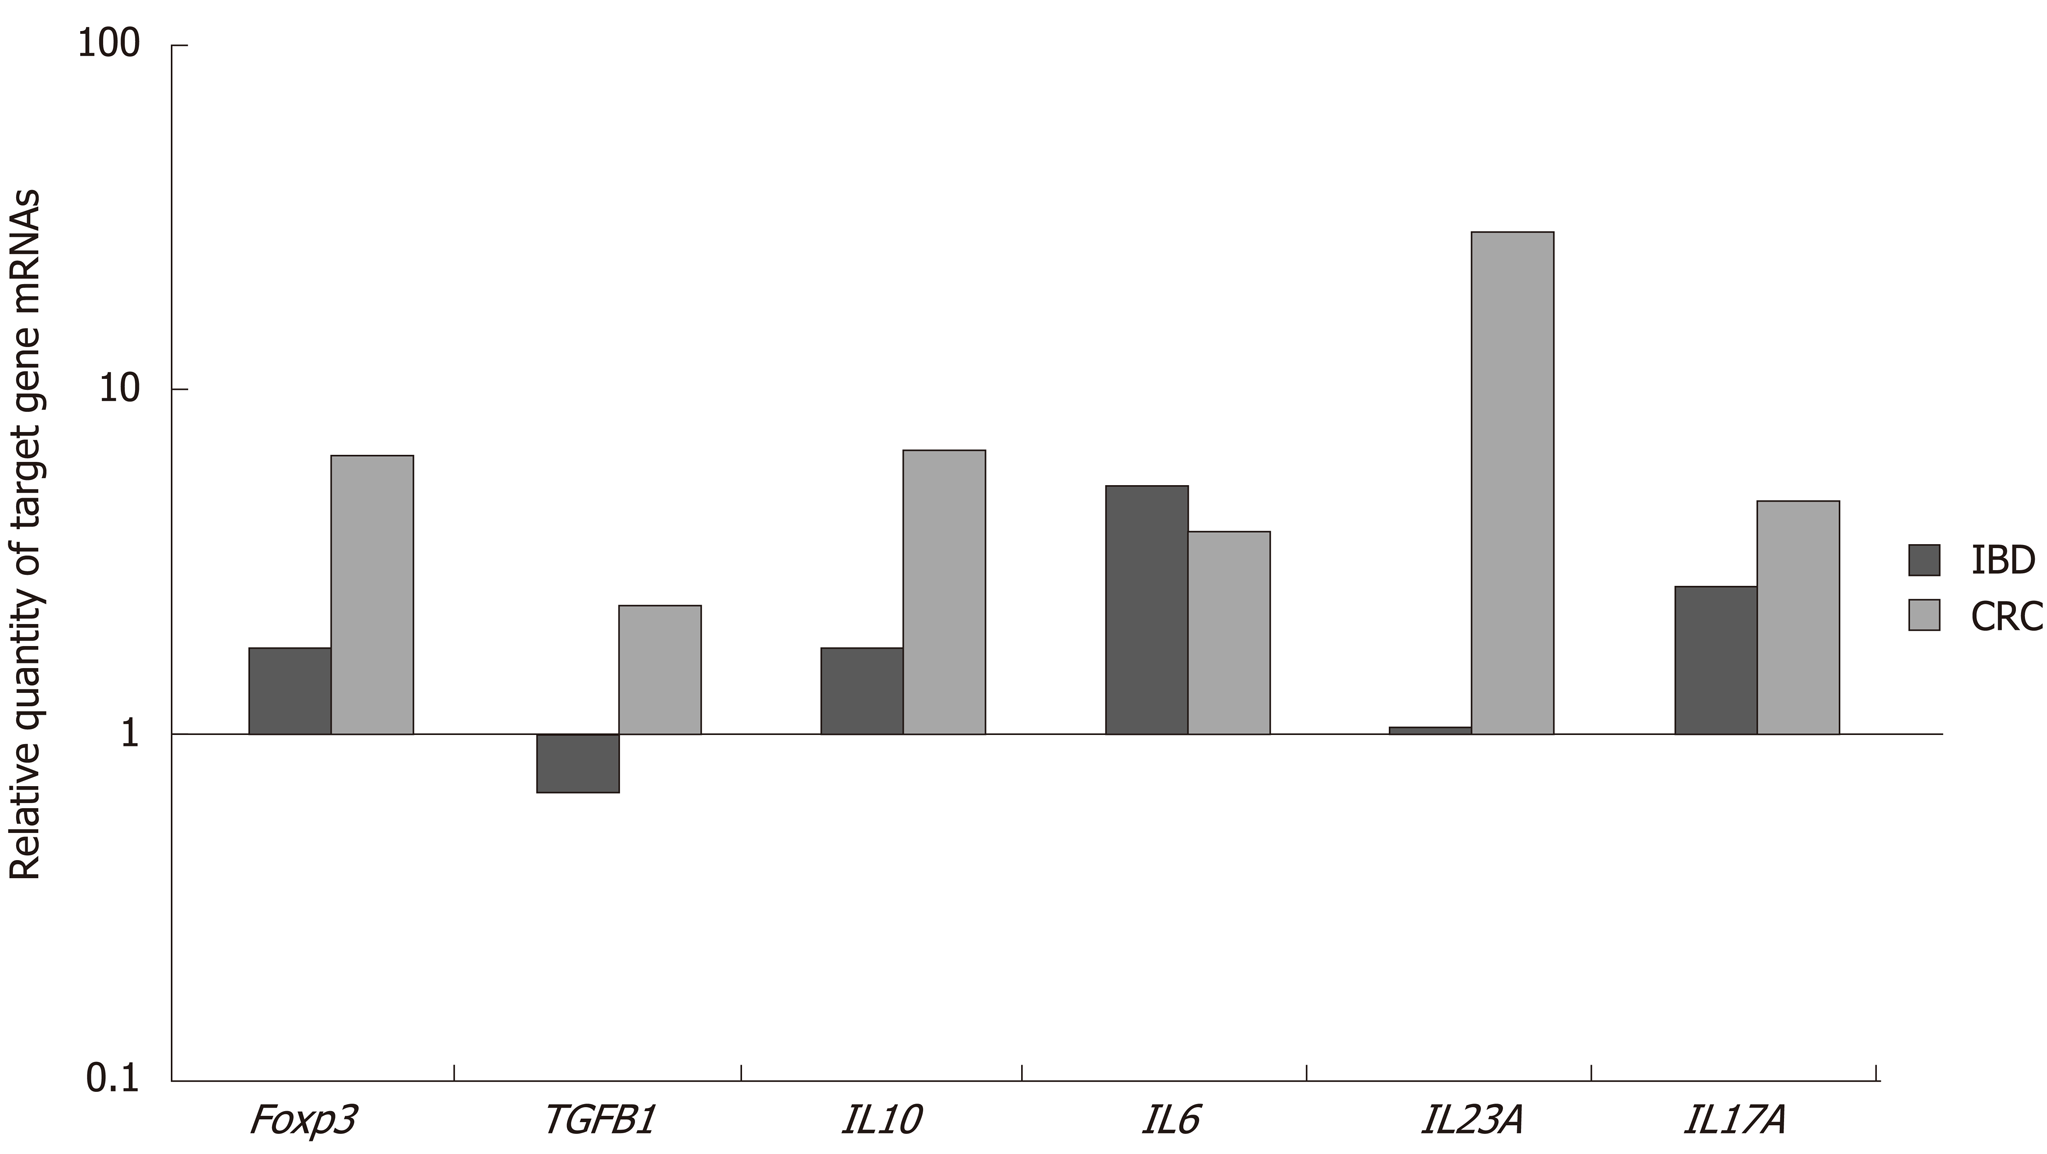
Figure 1 The relative quantity of mRNA levels in inflamed and tumoral tissue calibrated to their adjacent regular counterparts after normalization to endogenous control–18S rRNA.
IBD: Inflammatory bowel disease; CRC: Colorectal cancer.
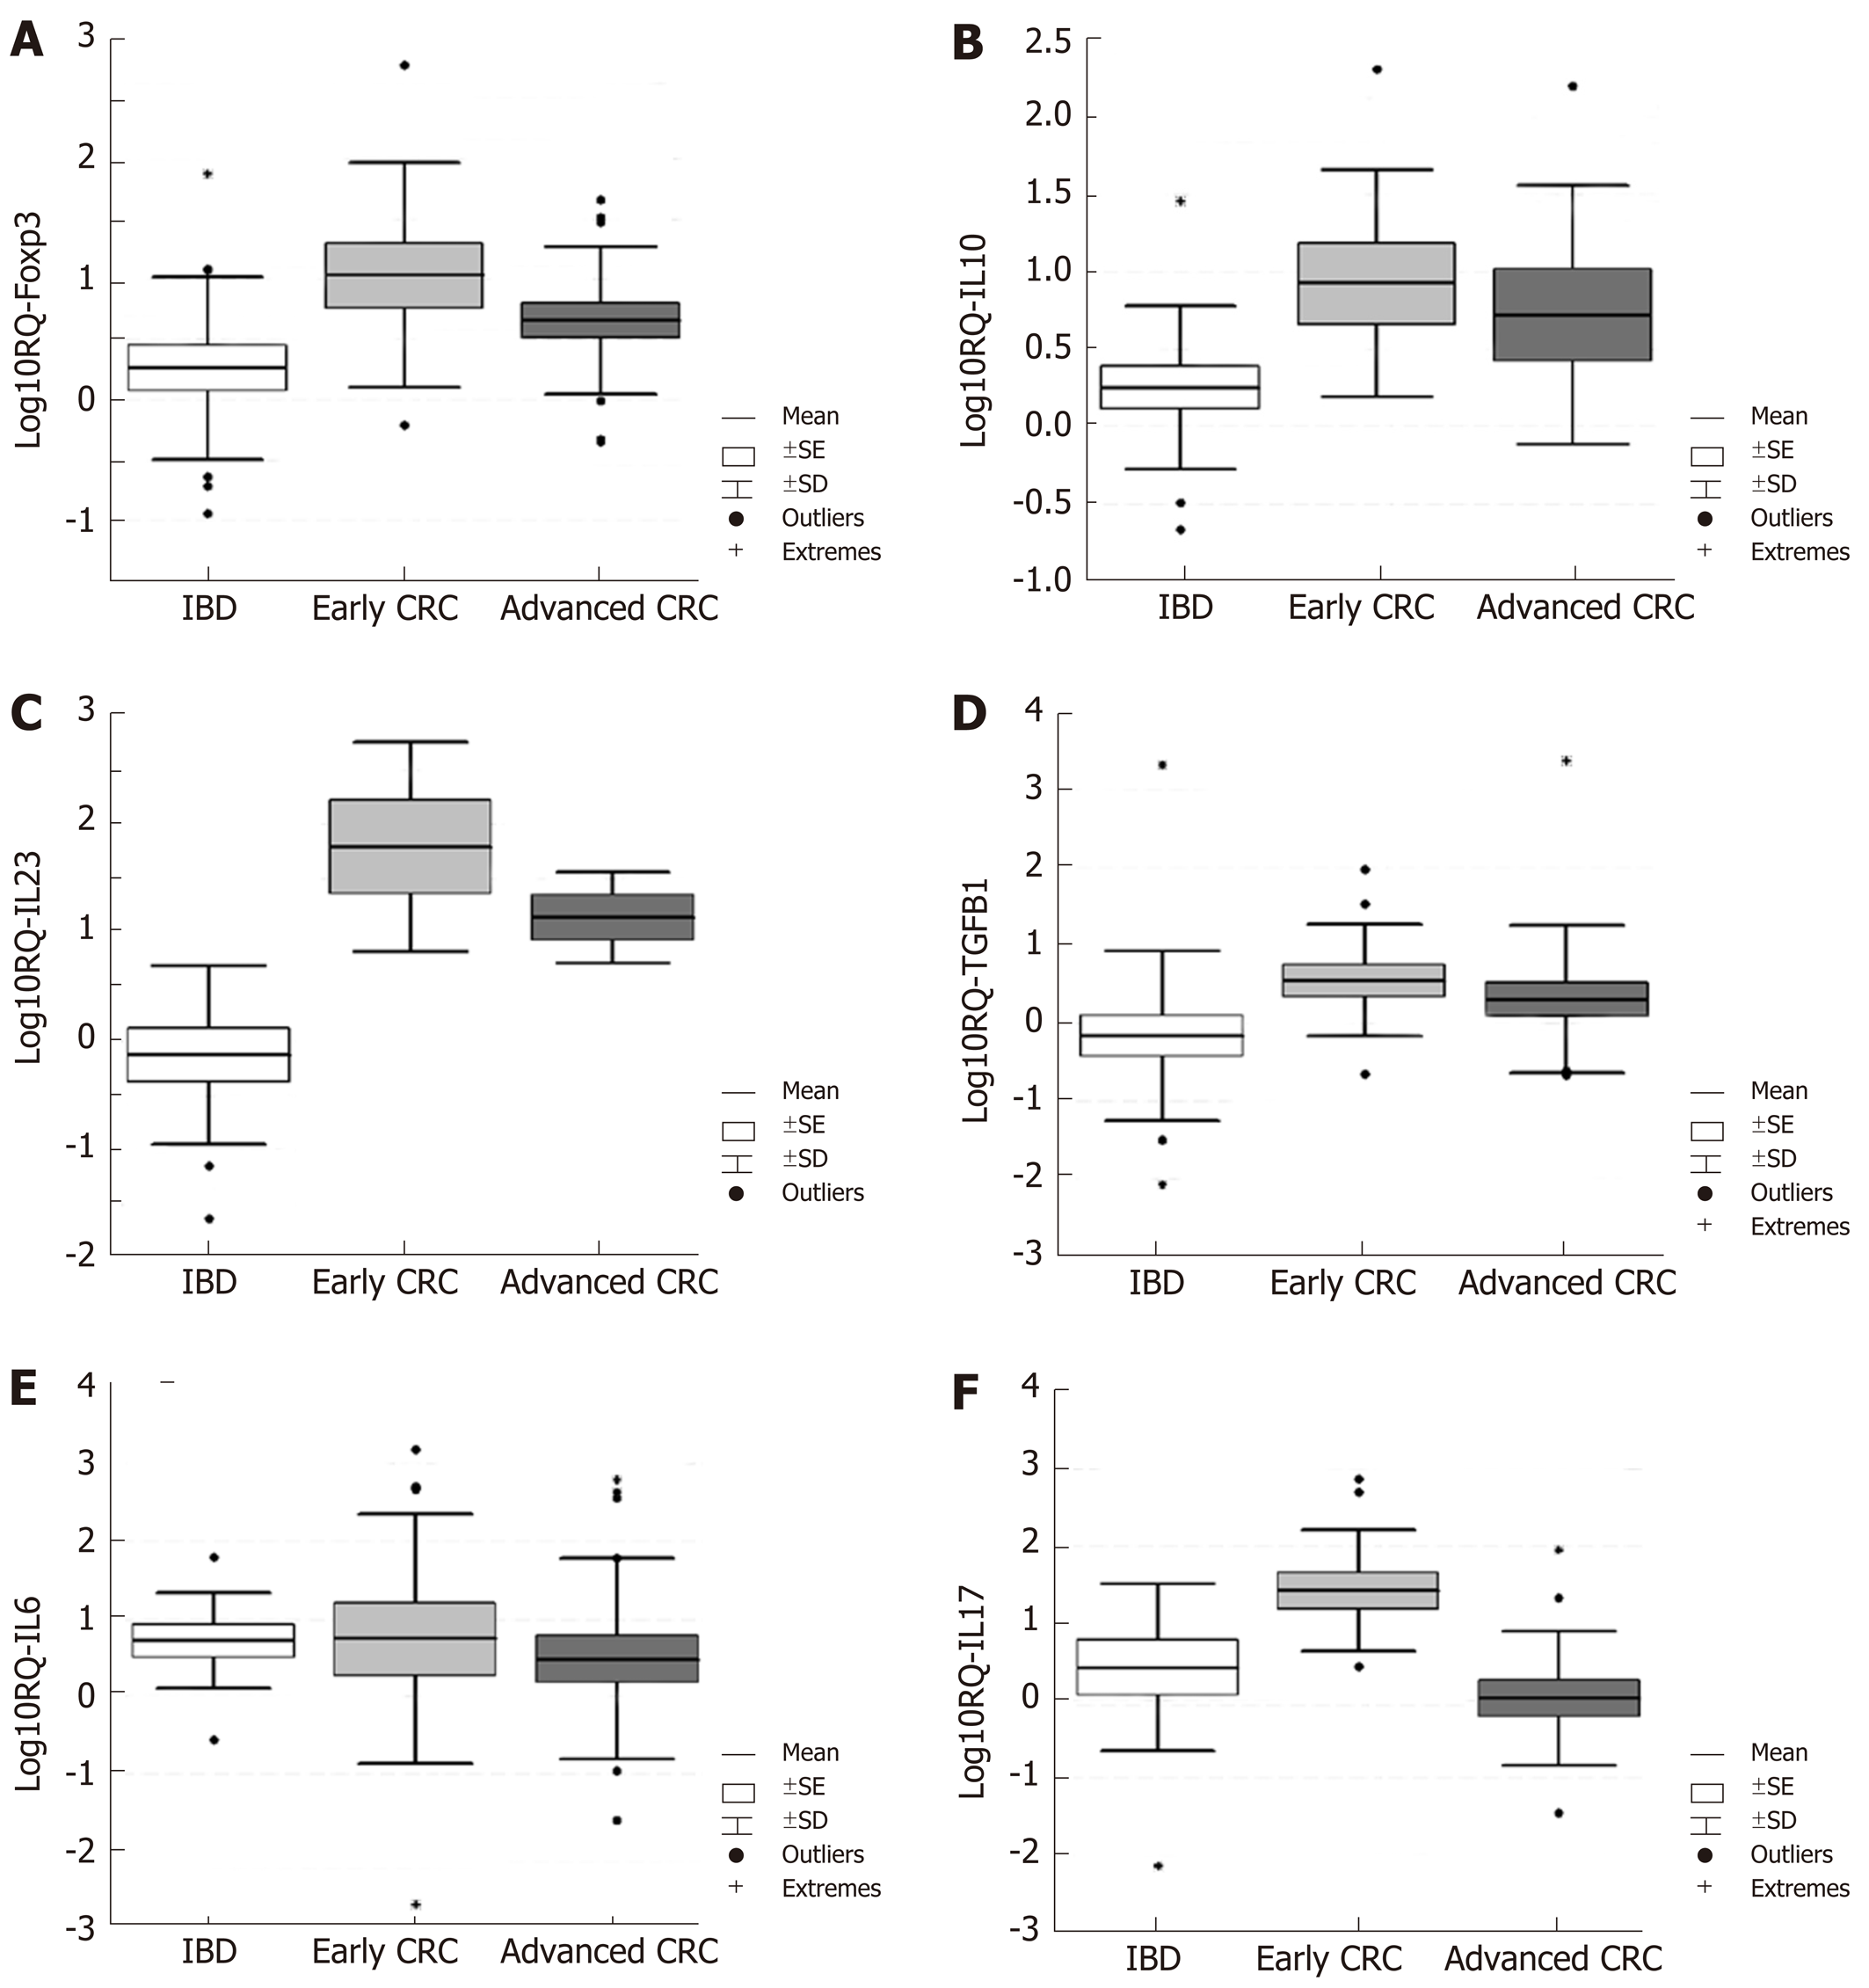
Figure 2 Local gene expression of Foxp3, IL-10; IL-23A; TGFB1; IL-6 and IL-17A in inflammatory bowel disease patients and in early and advanced colorectal cancer cases.
A: Foxp3; B: IL-10; C: IL-23A; D: TGFB1; E: IL-6; F: IL-17A. The relative quantity of target mRNAs in inflamed and tumoral tissue is calibrated to their normal counterparts after normalization to endogenous control–18S rRNA. The results are presented as mean (line) with standard error (box), and standard deviation (whiskers) of log-transformed fold changes (base 10). IBD: Inflammatory bowel disease; CRC: Colorectal cancer.
Figure 3 Serum levels of anti- and pro-inflammatory cytokines.
A: IL-10; B: IL-23A; C: TGFB1; D: IL-6; E: IL-17A. In inflammatory bowel disease patients compared to early and advanced colorectal cancer cases. The results are presented as median with 25%-75% percentile. IBD: Inflammatory bowel disease; CRC: Colorectal cancer.
- Citation: Velikova TV, Miteva L, Stanilov N, Spassova Z, Stanilova SA. Interleukin-6 compared to the other Th17/Treg related cytokines in inflammatory bowel disease and colorectal cancer. World J Gastroenterol 2020; 26(16): 1912-1925
- URL: https://www.wjgnet.com/1007-9327/full/v26/i16/1912.htm
- DOI: https://dx.doi.org/10.3748/wjg.v26.i16.1912


