Copyright
©The Author(s) 2017.
World J Gastroenterol. Oct 14, 2017; 23(38): 6962-6972
Published online Oct 14, 2017. doi: 10.3748/wjg.v23.i38.6962
Published online Oct 14, 2017. doi: 10.3748/wjg.v23.i38.6962
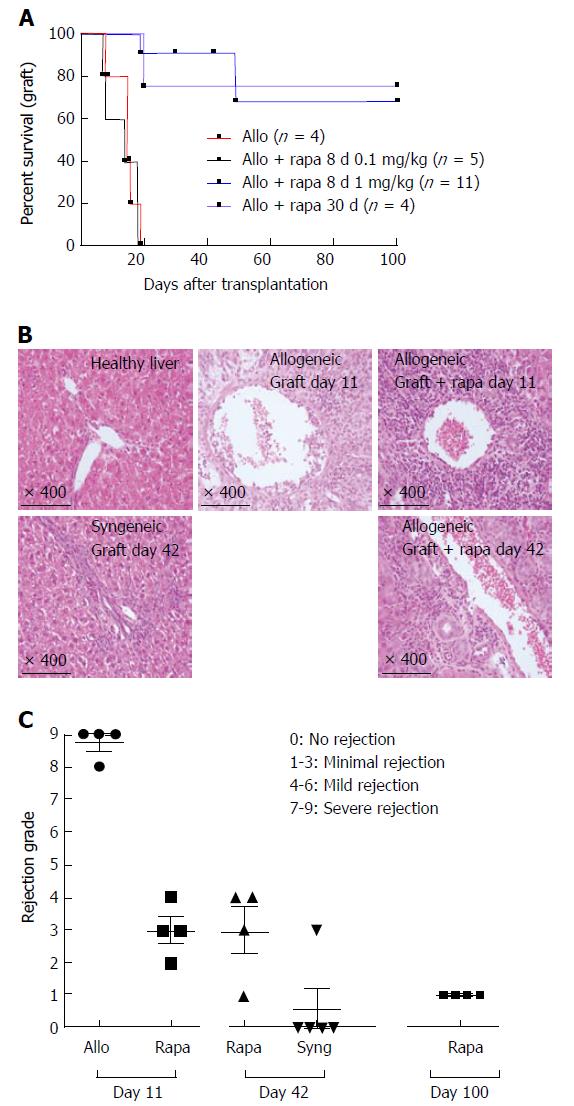
Figure 1 A short course of rapamycin prolongs liver transplantation in rats.
A: Fully allogeneic liver transplantation (DA donor to LEW recipient) was performed, and the rats were given no treatment or were treated with rapamycin as follows: a short course at a dose of 1 mg/kg (oral gavage for 8 d from day 4 to day 11, n = 11), a short course at a dose of 0.1 mg/kg (8-d treatment from day 4 to day 11, n = 5) or a long course at a dose of 1 mg/kg (30-d treatment from day 4 to day 34, n = 4). Survival curves based on cumulative data are shown; B: H and E-stained histological sections from biopsy samples of a healthy liver and a grafted liver at the time of sacrifice on day 11 after liver transplantation (no treatment vs short course of rapamycin at 1 mg/kg) and on day 42 (short course of rapamycin at 1 mg/kg vs syngeneic); C: Histological grading of liver grafts using Banff scoring on day 11 and day 42 after transplantation, n = 4-5 rats/group.
Figure 2 The protective effects of a short course of rapamycin on liver function.
Fully allogeneic liver transplantation (DA donor to LEW recipient) was performed, and the rats were given no treatment or were treated with 1 mg/kg rapamycin (8-d treatment from day 4 to day 11). Total bilirubin, ALAT, and ASAT expression levels were measured in rat sera on postoperative days 11 (control vs rapamycin) and 42 (rapamycin vs syngeneic graft). The graph shows the cumulative data from 4-5 rats/group. P-values are indicated when the differences between the two groups of rats are significant (bP ≤ 0.01, eP ≤ 0.001). ALAT: Alanine aminotransferase; ASAT: Aspartate aminotransferase.
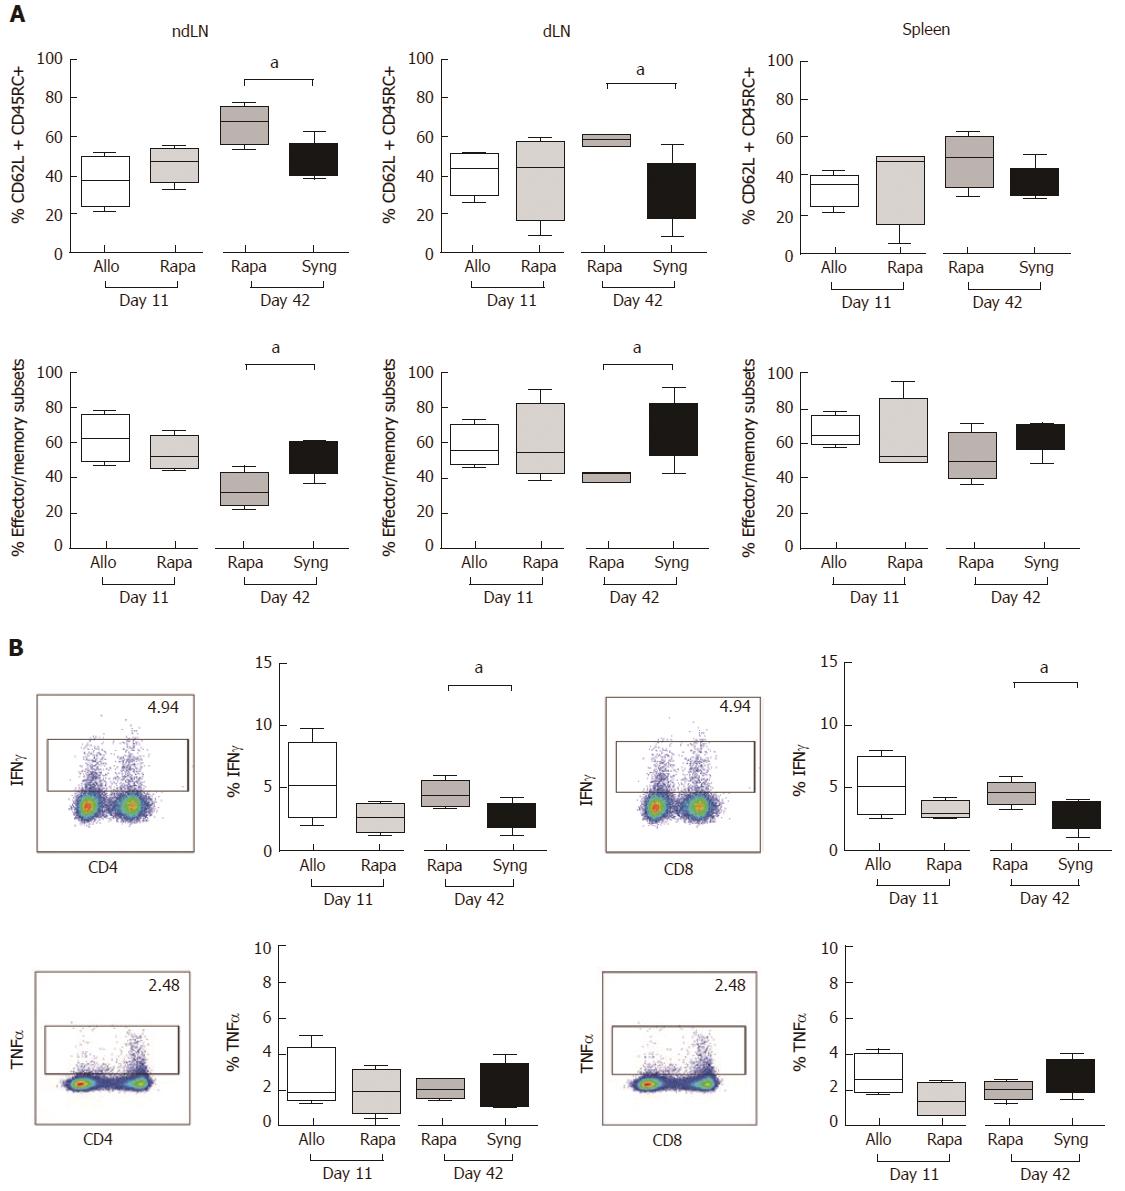
Figure 3 The effects of a short course of rapamycin treatment on naïve and effector memory cells (A) seems to transiently inhibit the T cell function (B).
A: The ndLNs, dLNs and spleens of grafted animals were collected on day 11 and day 42 and conventional T cells were analyzed by flow cytometry. Naïve T cells, defined as CD62L+CD45RC+, and effector/memory cells, defined as (CD62L-CD45RC-) + (CD62L+CD45RC-) + (CD62L-CD45RC+), were analyzed in CD4+Foxp3- and CD8+Foxp3- T cell populations. The results are expressed as the mean +/- SEM of the percentages of effector/memory and naïve T cells, respectively. P-values are indicated when the differences between the two groups of rats are significant (aP ≤ 0.05). The graph shows the cumulative data from 4-5 rats/group; B: Quantification of IFNγ and TNFα expression by CD4+ and CD8+ T cells in the dLNs of grafted animals after PMA/ionomycin stimulation for 4 h. The graph shows the cumulative data from 4-5 rats/group. The results are expressed as the mean +/- SEM. P-values are indicated when the differences between the two groups of rats are significant (aP ≤ 0.05).
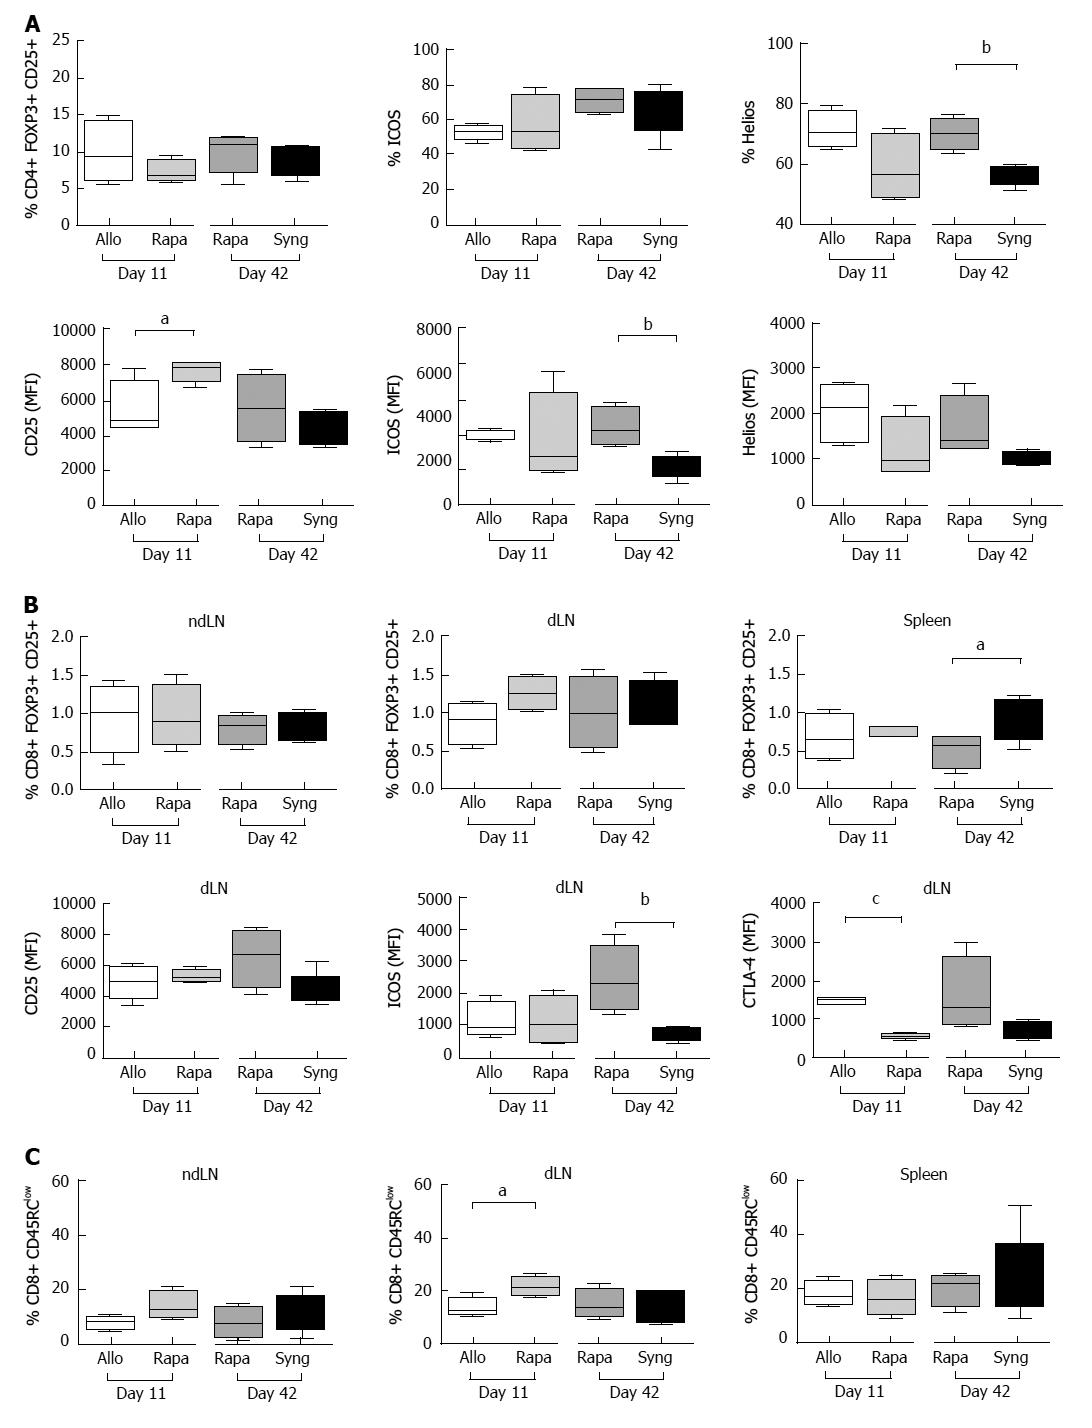
Figure 4 The effects of a short course of rapamycin treatment on CD4+ and CD8+ regulatory T cell phenotypes.
A: The dLNs of grafted animals were collected on day 11 and day 42 and regulatory CD4+ T cells were analyzed by flow cytometry. Different activation markers were studied (CD25+, ICOS+, Helios+) after gating on CD25+FOXP3+ among CD4+ cells. The results are expressed as the mean +/- SEM of the percentages of CD25+, ICOS+, and Helios+ or the MFI values for CD25, ICOS, and Helios; n = 4-5 rats/group. P-values are indicated when the differences between the two groups of rats are significant (aP ≤ 0.05, bP ≤ 0.01). MFI, mean fluorescence intensity; B: The ndLNs, dLNs and spleens of grafted animals were collected on day 11 and day 42 and the percentages of CD25+Foxp3+ regulatory CD8+ T cells were analyzed by flow cytometry. The MFI values of the activation markers (CD25, ICOS, and CTLA-4) are shown for the dLNs. The results are expressed as the mean +/- SEM. P-values are indicated when the differences between the two groups of rats are significant (aP ≤ 0.05, bP ≤ 0.01, cP ≤ 0.0001); C: The percentages of CD45RClow cells among CD8+ cells in the dLNs, ndLNs and spleens of grafted rats are shown. The results are expressed as the mean +/- SEM. P-values are indicated when the differences between the two groups of rats are significant (aP ≤ 0.05).
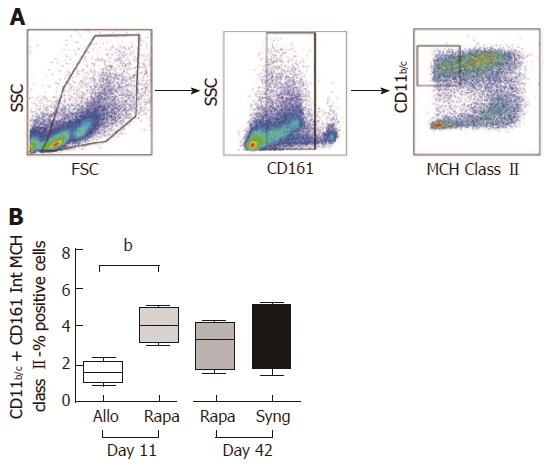
Figure 5 A short course of rapamycin increases myeloid-derived suppressor cells numbers on postoperative day 11 in allogeneic liver-grafted rats.
The spleens of grafted animals were collected on day 11 and day 42, and myeloid-derived suppressor cells (MDSCs) were analyzed by flow cytometry. A: Gating strategy for MDSC analysis: CD11b/c+CD161intMCH class II-; B: Cumulative data indicating MDSC percentages. The results are expressed as the mean +/- SEM of the MDSC percentages. P-values are indicated when the differences between the two groups of rats are significant (bP ≤ 0.01).
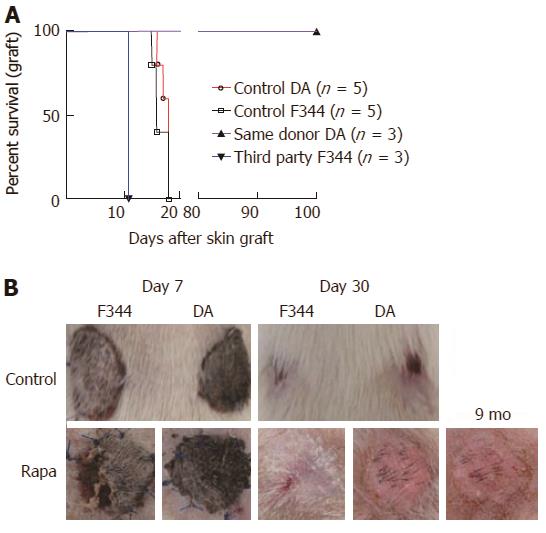
Figure 6 A short course of rapamycin induces antigen-specific tolerance.
Allogeneic liver transplantations were performed (DA donor to LEW recipients), and the rats were treated with a short course of rapamycin (1 mg/kg, days 4 to 11). On day 30 after liver transplantation, skin grafts were performed with skin from the same DA donor or from third-party F344 rats. The control groups received allogeneic skin grafts from DA or F344 donors with rats (LEW) that did not undergo liver transplantation. A: Cumulative survival curves; days indicate the days post-skin graft, n = 3-5 rats/group; B: Representative images are shown on day 7 and day 30 after skin grafts.
- Citation: Hamdani S, Thiolat A, Naserian S, Grondin C, Moutereau S, Hulin A, Calderaro J, Grimbert P, Cohen JL, Azoulay D, Pilon C. Delayed and short course of rapamycin prevents organ rejection after allogeneic liver transplantation in rats. World J Gastroenterol 2017; 23(38): 6962-6972
- URL: https://www.wjgnet.com/1007-9327/full/v23/i38/6962.htm
- DOI: https://dx.doi.org/10.3748/wjg.v23.i38.6962


