Copyright
©The Author(s) 2017.
World J Gastroenterol. Apr 14, 2017; 23(14): 2592-2600
Published online Apr 14, 2017. doi: 10.3748/wjg.v23.i14.2592
Published online Apr 14, 2017. doi: 10.3748/wjg.v23.i14.2592
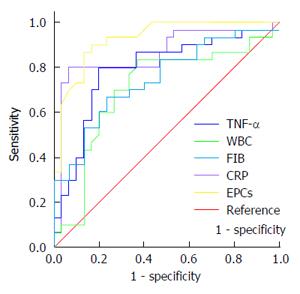
Figure 1 Receiver operating characteristic curves of endothelial progenitor cells, tumor necrosis factor-alpha, white blood cell count, fibrinogen and C-reactive protein.
The severe acute pancreatitis group was taken as the positive group and the MAP group was taken as the negative group. EPCs: Endothelial progenitor cells; TNF-α: Tumor necrosis factor-alpha; WBC: White blood cell count; FIB: Fibrinogen; CRP: C-reactive protein.
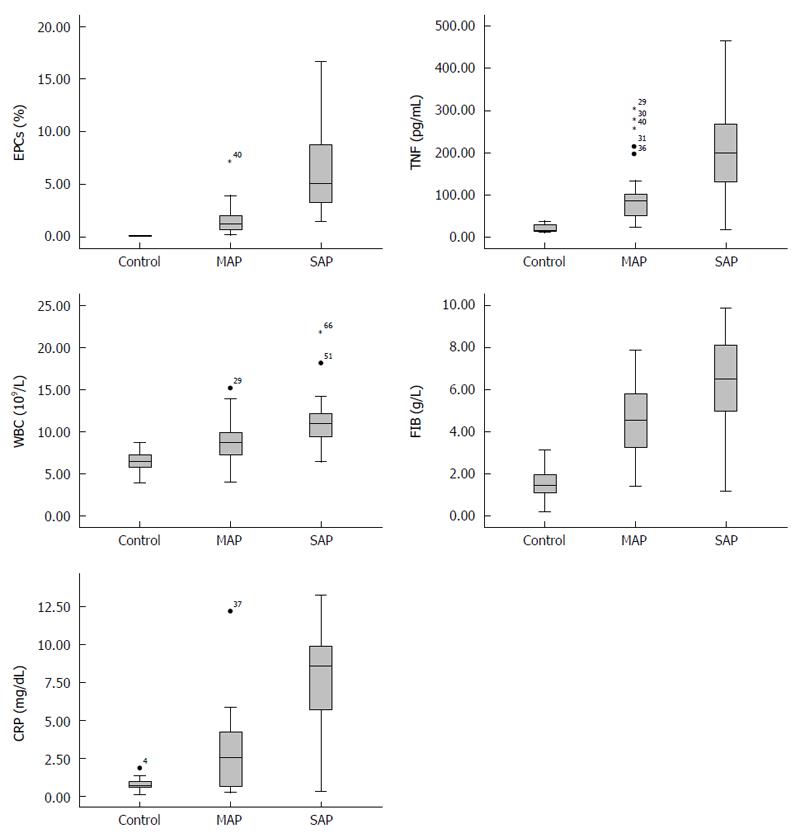
Figure 2 Distribution of data for the endothelial progenitor cells, tumor necrosis factor-alpha, white blood cell count, fibrinogen and C-reactive protein in each group was asymmetrical.
EPCs: Endothelial progenitor cells; TNF-α: Tumor necrosis factor-alpha; WBC: White blood cell count; FIB: Fibrinogen; CRP: C-reactive protein.
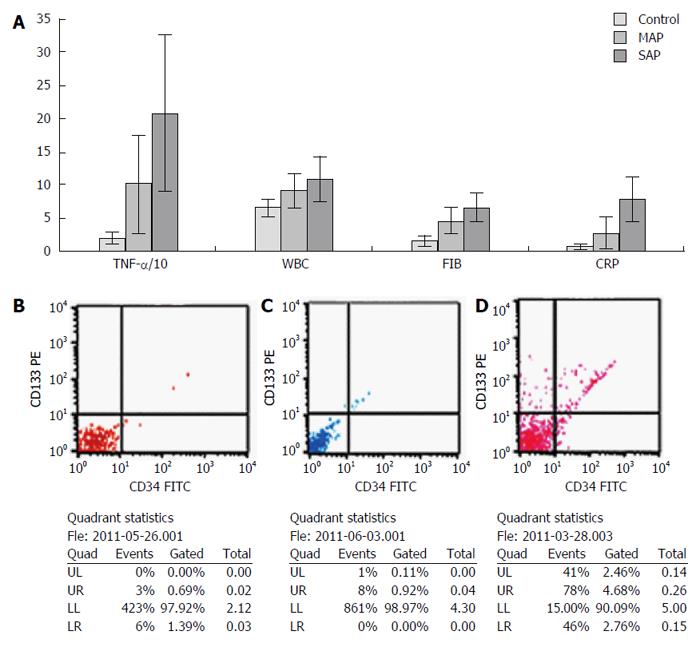
Figure 3 Contrast of the five markers.
A: Comparison of the levels of tumor necrosis factor-alpha (TNF-α), white blood cell count (WBC), fibrinogen (FIB), and C-reactive protein (CRP) in the peripheral blood. The levels of TNF-α, WBC, FIB and CRP in the control, mild acute pancreatitis (MAP) and severe acute pancreatitis (SAP) groups increased in sequence; B, C, D: Flow cytometric analysis of endothelial progenitor cells (EPCs). The mean levels of EPCs in the control, MAP and SAP groups were 0.55 ± 0.54, 1.63 ± 1.47 and 6.61 ± 4.28, respectively. There was a significant difference between the MAP and SAP groups (P < 0.01). However, the level of EPCs in the control and MAP groups was similar.
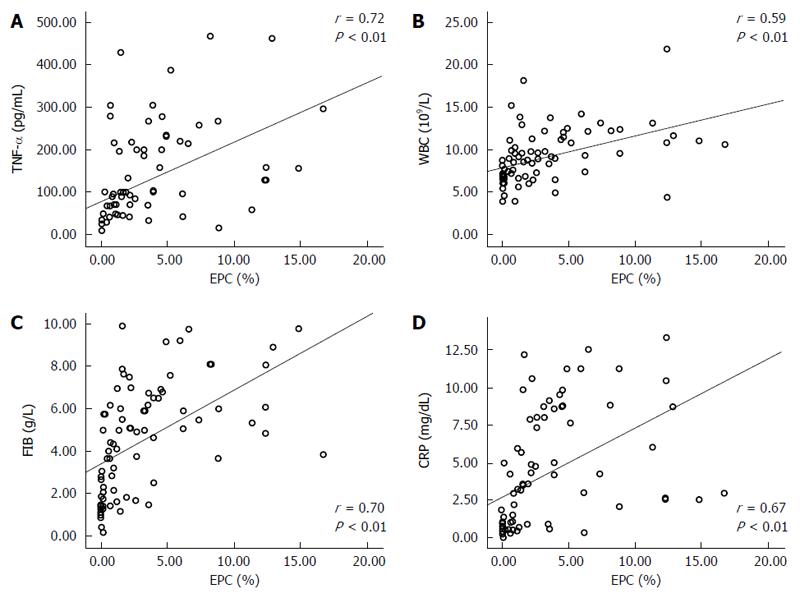
Figure 4 Spearman’s correlations between endothelial progenitor cells and the other four markers showed the endothelial progenitor cells had a positive correlation with the other four markers.
A-D: The closest correlation was between endothelial progenitor cells (EPCs) and tumor necrosis factor-alpha (TNF-α) (r = 0.72, P < 0.01).
- Citation: Ha XQ, Song YJ, Zhao HB, Ta WW, Gao HW, Feng QS, Dong JZ, Deng ZY, Fan HY, Peng JH, Yang ZH, Zhao Y. Endothelial progenitor cells in peripheral blood may serve as a biological marker to predict severe acute pancreatitis. World J Gastroenterol 2017; 23(14): 2592-2600
- URL: https://www.wjgnet.com/1007-9327/full/v23/i14/2592.htm
- DOI: https://dx.doi.org/10.3748/wjg.v23.i14.2592


