Copyright
©The Author(s) 2016.
World J Gastroenterol. Dec 14, 2016; 22(46): 10180-10188
Published online Dec 14, 2016. doi: 10.3748/wjg.v22.i46.10180
Published online Dec 14, 2016. doi: 10.3748/wjg.v22.i46.10180
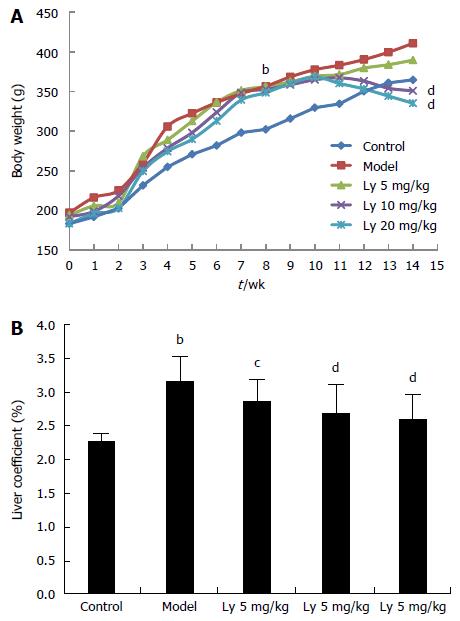
Figure 1 Effects of lycopene on body weight (A) and liver coefficient (B).
bP < 0.01 vs control group; cP < 0.05, dP < 0.01 vs model group. Ly: Lycopene.
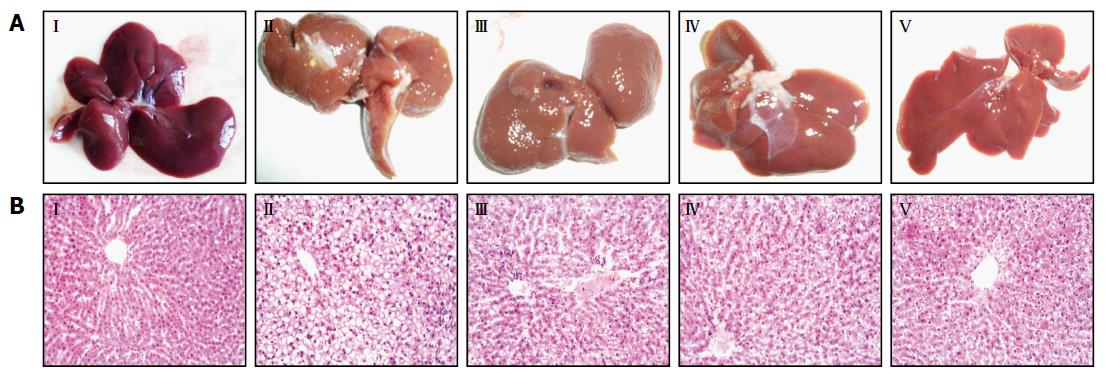
Figure 2 Appearance of rat liver tissue (A) and histopathological examination by HE (B, 200 ×).
I: Control group; II: Model group; III: Ly 5 mg/kg group; IV: Ly 10 mg/kg group; V: Ly 20 mg/kg group. Ly: Lycopene.
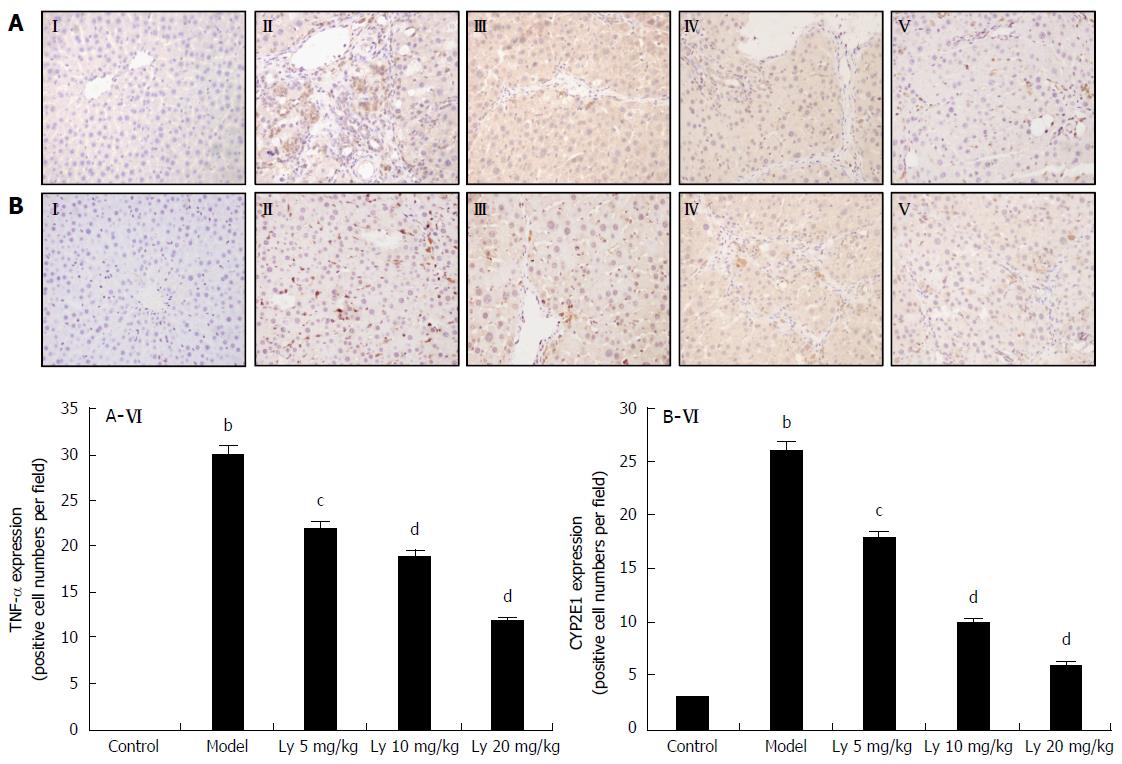
Figure 3 Representative photographs of immunological histological chemistry examination (200 ×).
A: TNF-α; B: CYP2E1. I: Control group; II: Model group; III: Ly 5 mg/kg group; IV: Ly 10 mg/kg group; V: Ly 20 mg/kg group; VI: Quantification of TNF-α (A-VI) and CYP2E1 (B-VI) stained cells. The results are expressed as mean ± SD of 12 rats. bP < 0.01 vs control group; cP < 0.05, dP < 0.01 vs model group. Ly: Lycopene.
- Citation: Jiang W, Guo MH, Hai X. Hepatoprotective and antioxidant effects of lycopene on non-alcoholic fatty liver disease in rat. World J Gastroenterol 2016; 22(46): 10180-10188
- URL: https://www.wjgnet.com/1007-9327/full/v22/i46/10180.htm
- DOI: https://dx.doi.org/10.3748/wjg.v22.i46.10180


