Copyright
©The Author(s) 2016.
World J Gastroenterol. Jun 7, 2016; 22(21): 5023-5032
Published online Jun 7, 2016. doi: 10.3748/wjg.v22.i21.5023
Published online Jun 7, 2016. doi: 10.3748/wjg.v22.i21.5023
Figure 1 Time points of PBS or recombinant interleukin-22 injection.
PBS: Phosphate-buffered saline; rIL-22: Recombinant interleukin-22.
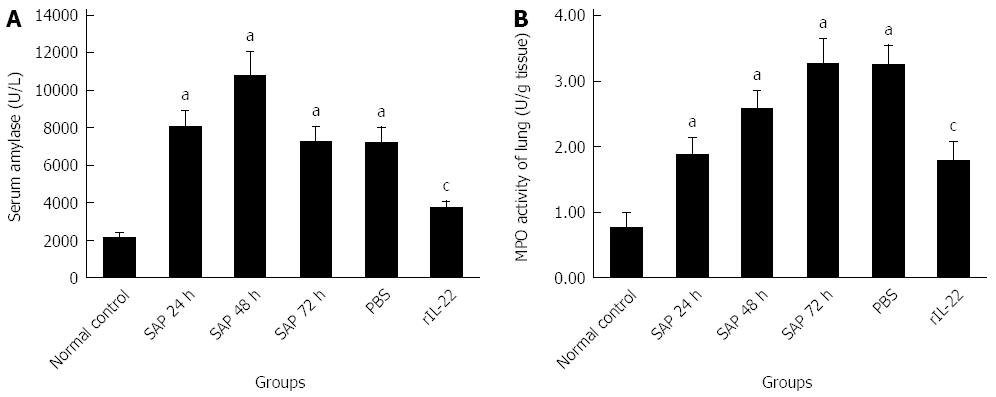
Figure 2 Serum amylase (A) and activity of lung myeloperoxidase (B).
Numbers of cases from each group statistically analyzed are 12 (Normal control), 9 (SAP 24 h), 8 (SAP 48 h), 8 (SAP 72 h), 8 (PBS) and 12 (rIL-22). Results are presented as mean ± SD. aP < 0.05 vs the normal control group, cP < 0.05 vs the SAP group at 72 h. SAP: Acute severe pancreatitis; MPO: Myeloperoxidase; PBS: Phosphate-buffered saline; rIL-22: Recombinant interleukin-22.
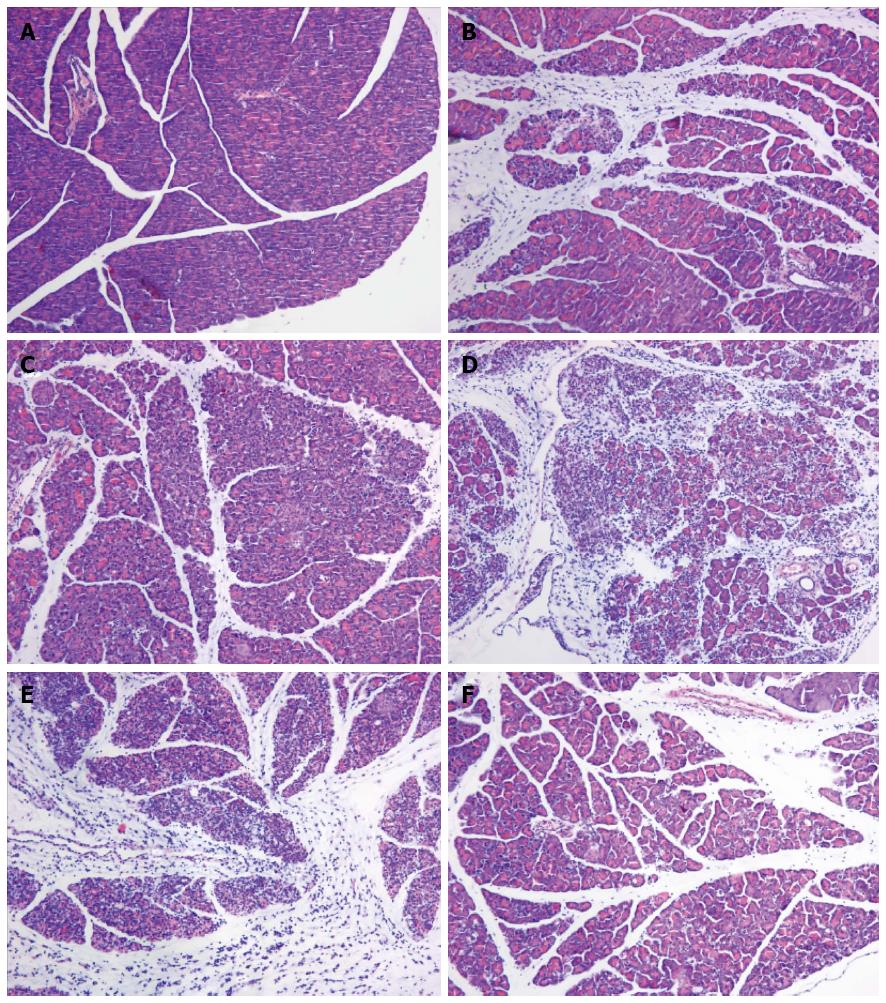
Figure 3 Hematoxylin and eosin staining of the pancreas.
Normal control group (A), SAP group (B: 24 h after L-arginine injection; C: 48 after L-arginine injection; D: 72 h after L-arginine injection), PBS group (E) and rIL-22 group (F). Original magnification × 200. SAP: Acute severe pancreatitis; PBS: Phosphate-buffered saline; rIL-22: Recombinant interleukin-22.
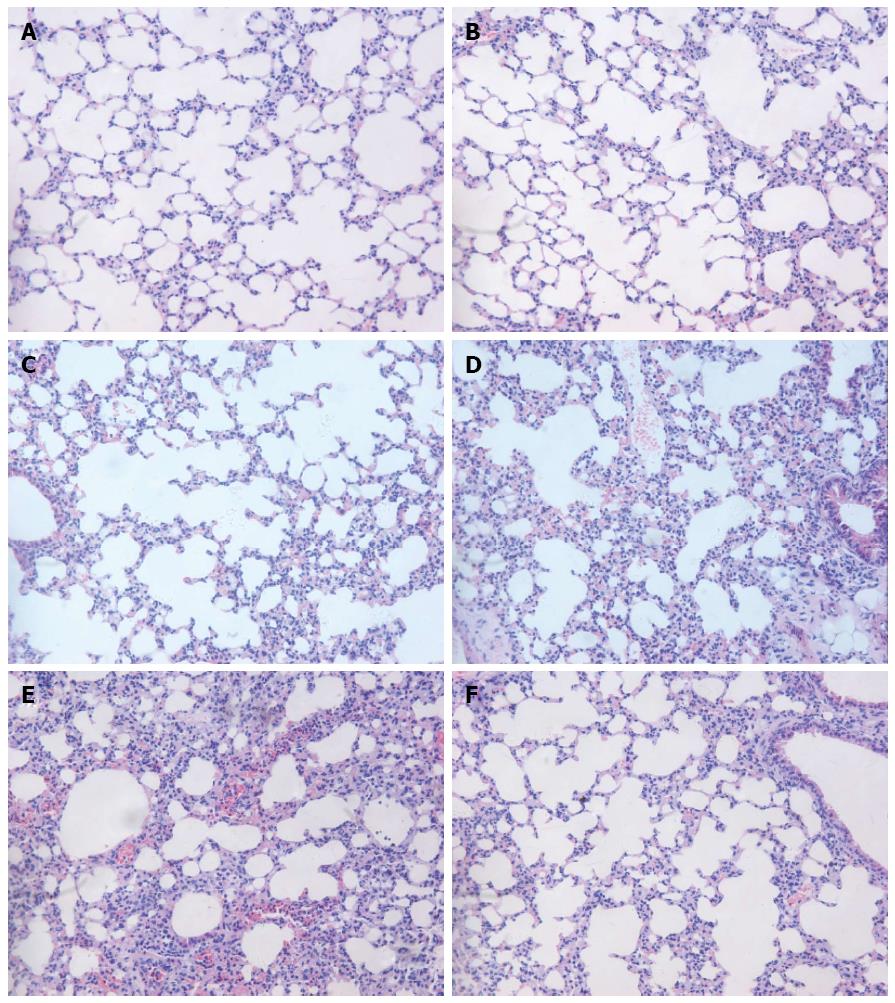
Figure 4 Hematoxylin-eosin staining of the lung.
Normal control group (A), SAP group (B: 24 h after L-arginine injection; C: 48 h after L-arginine injection; D: 72 h after L-arginine injection), PBS group (E) and rIL-22 group (F). Original magnification × 200. SAP: Acute severe pancreatitis; PBS: Phosphate-buffered saline; rIL-22: Recombinant interleukin-22.
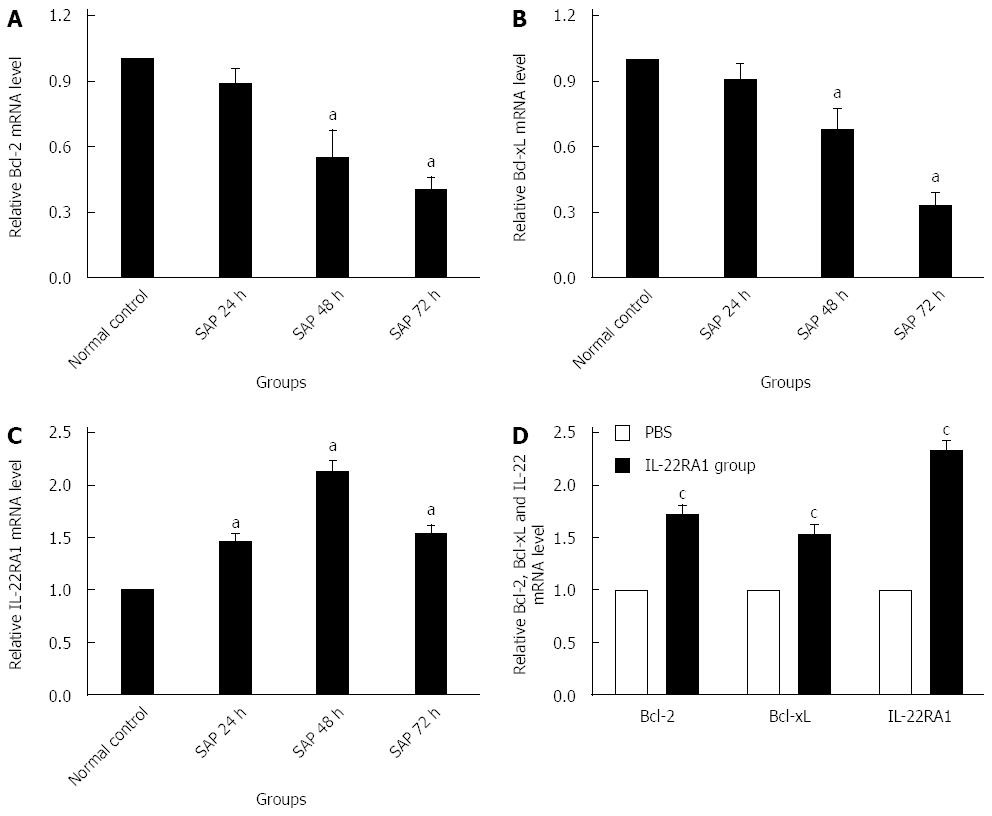
Figure 5 Real-time PCR analysis of expression of Bcl-2(A and D), Bcl-xL (B and D) and IL-22RA1 mRNAs (C and D) in lung tissue.
Numbers of cases from each group statistically analyzed are 12 (Normal control), 9 (SAP 24 h), 8 (SAP 48 h), 8 (SAP 72 h), 8 (PBS) and 12 (rIL-22). Results are presented as mean ± SD. aP < 0.05 vs the normal control group, cP < 0.05 vs the PBS group. Bcl-2: B cell lymphoma/leukemia-2; Bcl-xL: B cell lymphoma/leukemia-extra large; IL-22RA1: Interleukin-22 receptor subunit alpha-1; PBS: Phosphate-buffered saline; rIL-22: Recombinant interleukin-22; STAT3: Signal transducer and activator of transcription 3.
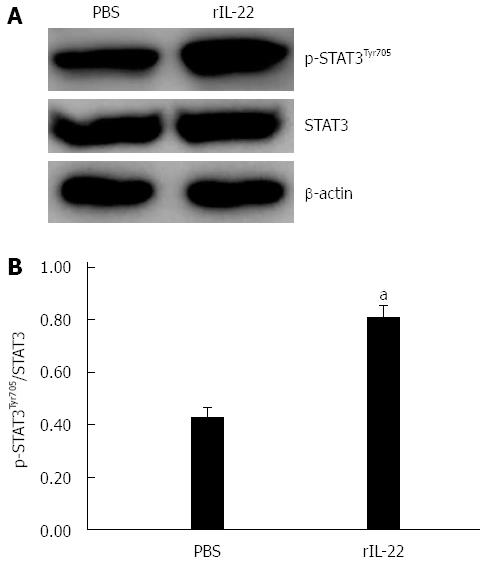
Figure 6 Western blot analysis of expression and activation (Tyr705 phosphorylation) of STAT3 protein in lung tissue (A) and the ratio of p-STAT3Tyr705 to STAT3 protein (B).
Numbers of cases from each group statistically analyzed were 8 (PBS) and 12 (rIL-22). Results are presented as mean ± SD. aP < 0.05 vs the PBS group. PBS: Phosphate-buffered saline; rIL-22: Recombinant interleukin-22; STAT3: Signal transducer and activator of transcription 3.
- Citation: Qiao YY, Liu XQ, Xu CQ, Zhang Z, Xu HW. Interleukin-22 ameliorates acute severe pancreatitis-associated lung injury in mice. World J Gastroenterol 2016; 22(21): 5023-5032
- URL: https://www.wjgnet.com/1007-9327/full/v22/i21/5023.htm
- DOI: https://dx.doi.org/10.3748/wjg.v22.i21.5023


