Copyright
©The Author(s) 2015.
World J Gastroenterol. Feb 7, 2015; 21(5): 1457-1467
Published online Feb 7, 2015. doi: 10.3748/wjg.v21.i5.1457
Published online Feb 7, 2015. doi: 10.3748/wjg.v21.i5.1457
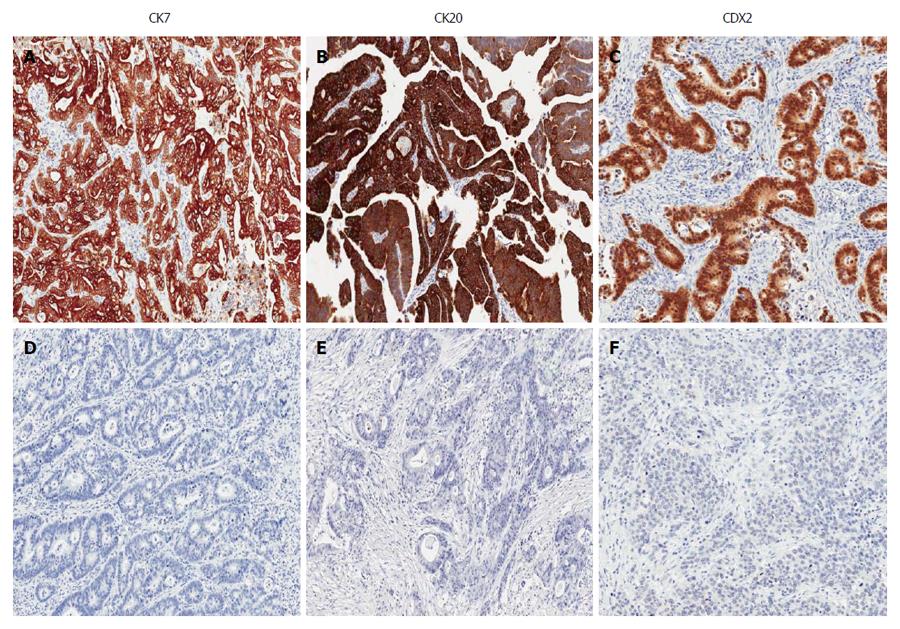
Figure 1 Immunohistochemical study findings of colorectal cancers (magnification × 200).
A: CK7 expression; B: Retained CK20 expression; C: Retained CDX2 expression; D: CK7 no-expression; E: Decreased CK20 expression; F: Loss of CDX2 expression. CK: Cytokeratin.
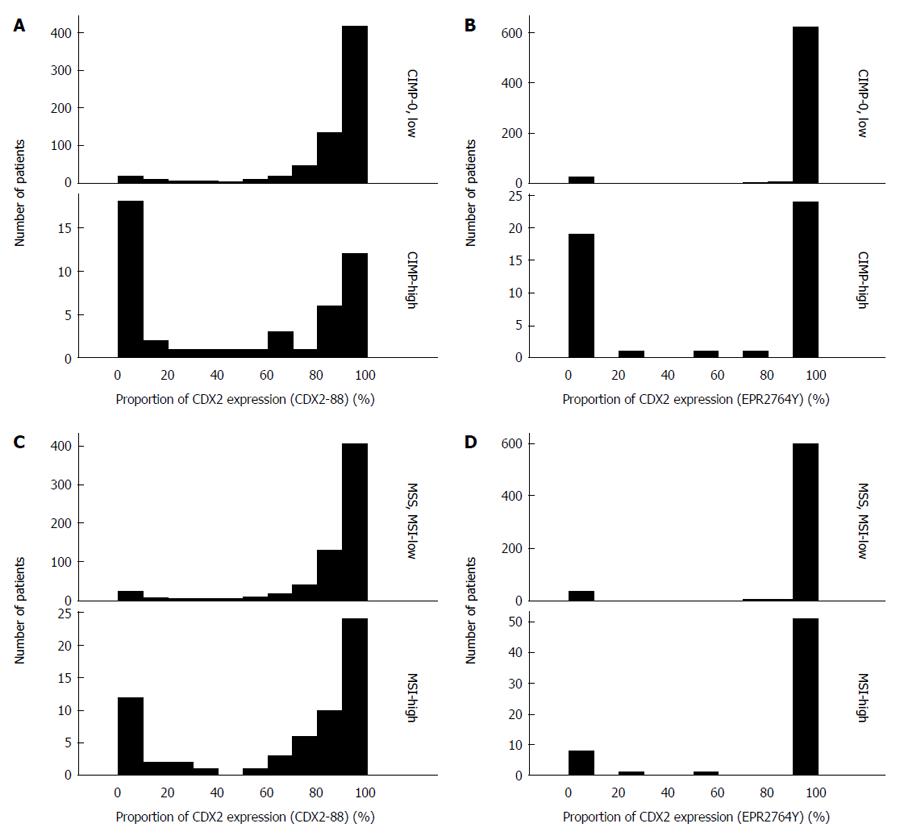
Figure 2 Histogram for loss of CDX2 expression using two different anti-CDX2 primary antibodies in immunohistochemistry.
A, B: Histogram of CDX2 expression according to CIMP status (A: CDX2-88; B: EPR2764Y); C, D: Histogram of CDX2 expression according to MSI status (C: CDX2-88; D: EPR2764Y). CIMP: CpG island methylator phenotype; MSI: Microsatellite instability; MSS: Microsatellite stable.
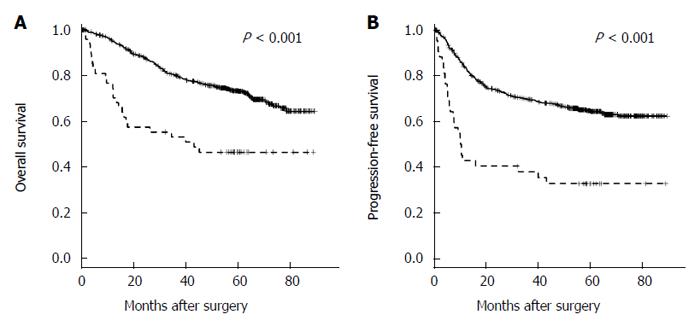
Figure 3 Kaplan-Meier survival curves according to CDX2 expression in colorectal cancers.
A: Overall survival (P < 0.001); B: Progression-free survival (P < 0.001). Linear line: Retained CDX2 expression, dashed line: Loss of CDX2 expression. Cut-off for loss of CDX2 expression < 20% of tumor cells showing nuclear positivity.
- Citation: Bae JM, Lee TH, Cho NY, Kim TY, Kang GH. Loss of CDX2 expression is associated with poor prognosis in colorectal cancer patients. World J Gastroenterol 2015; 21(5): 1457-1467
- URL: https://www.wjgnet.com/1007-9327/full/v21/i5/1457.htm
- DOI: https://dx.doi.org/10.3748/wjg.v21.i5.1457


