Copyright
©The Author(s) 2015.
World J Gastroenterol. Dec 7, 2015; 21(45): 12888-12895
Published online Dec 7, 2015. doi: 10.3748/wjg.v21.i45.12888
Published online Dec 7, 2015. doi: 10.3748/wjg.v21.i45.12888
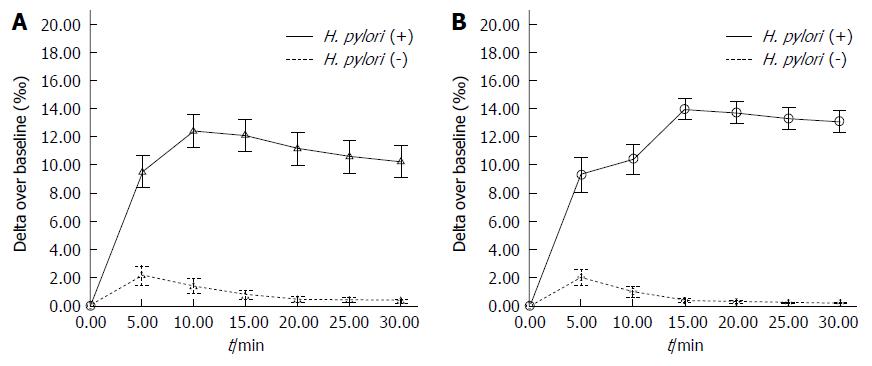
Figure 1 Mean delta over baseline values for the Helicobacter pylori-positive or -negative subjects in the sitting position at each time point.
A: Subgroup A; B: Subgroup B.
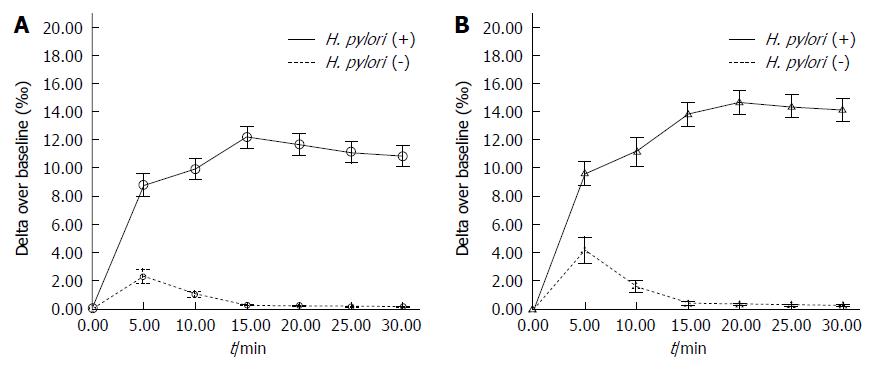
Figure 2 Mean delta over baseline values for the Helicobacter pylori-positive or -negative subjects in the right (A)/left (B) lateral recumbent position at each time point.
A: Subgroup C; B: Subgroup D.
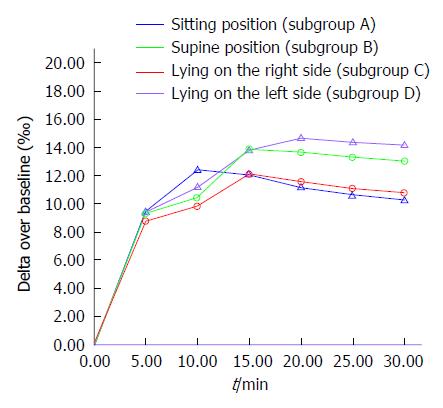
Figure 3 Mean delta over baseline value curves in the four subgroups of the infection group.
- Citation: Yin SM, Zhang F, Shi DM, Xiang P, Xiao L, Huang YQ, Zhang GS, Bao ZJ. Effect of posture on 13C-urea breath test in partial gastrectomy patients. World J Gastroenterol 2015; 21(45): 12888-12895
- URL: https://www.wjgnet.com/1007-9327/full/v21/i45/12888.htm
- DOI: https://dx.doi.org/10.3748/wjg.v21.i45.12888


