Copyright
©The Author(s) 2015.
World J Gastroenterol. Sep 21, 2015; 21(35): 10166-10173
Published online Sep 21, 2015. doi: 10.3748/wjg.v21.i35.10166
Published online Sep 21, 2015. doi: 10.3748/wjg.v21.i35.10166
Figure 1 Computed tomography scan revealing a large mass and stone (arrow) with suspected hepatic invasion (A) and asymmetric thickened gallbladder wall with homogeneous enhancement of a continuous mucosal line and submucosal hypoattenuated nodule (arrow) (B).
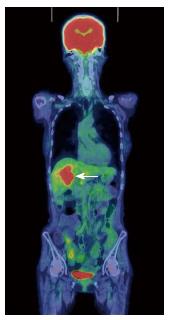
Figure 2 Fluorodeoxyglucose positron emission tomography showing abnormal accumulation in the hepatic hilum (SUVmax = 10.
2).
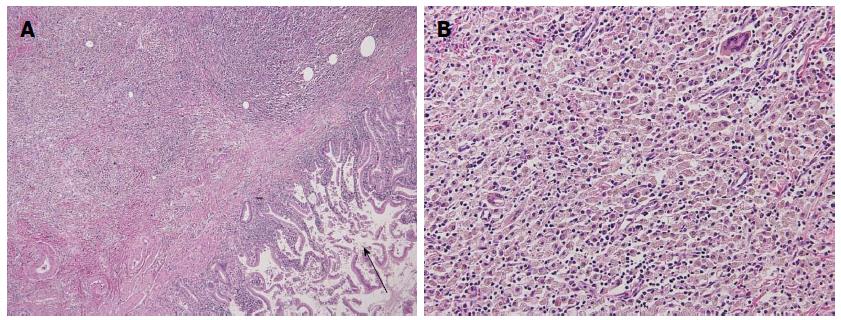
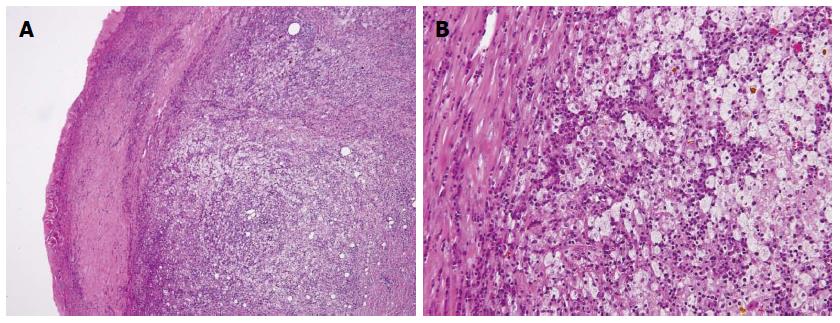
Figure 3 Histology of the gallbladder mucosa showing hyperplasia (A), HE × 200; the adjacent liver showing diffuse inflammatory infiltrate consisting of giant histiocytes and foamy histiocytes with clear lipid-containing cytoplasm, lymphocytes, and polymorphonuclear cells (B), HE × 400.
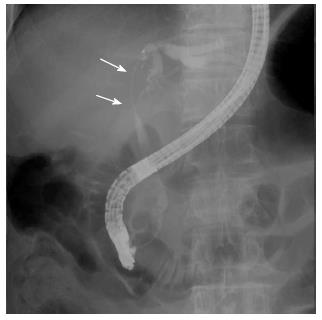
Figure 4 ERC revealing a filiform stenosis of the proximal common bile duct and bifurcation.
ERC: Endoscopic retrograde cholangiography.
Figure 5 Computed tomography scan revealing a hypodense mass at the hilum (A) and intrahepatic bile duct dilatation due to the tumor (B).
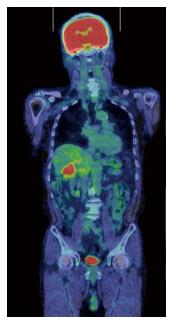
Figure 6 Fluorodeoxyglucose positron emission tomography showing abnormal accumulation at the hepatic hilum (SUVmax = 5.
2).
Figure 7 Microscopic examination revealing a gallbladder wall markedly thickened with severe inflammation and fibrosis (A), HE × 200; Large xanthoma cell with clear-to-foamy lipid-containing cytoplasm and interspersed lymphocytes invading the liver (B), HE × 400.
- Citation: Suzuki H, Wada S, Araki K, Kubo N, Watanabe A, Tsukagoshi M, Kuwano H. Xanthogranulomatous cholecystitis: Difficulty in differentiating from gallbladder cancer. World J Gastroenterol 2015; 21(35): 10166-10173
- URL: https://www.wjgnet.com/1007-9327/full/v21/i35/10166.htm
- DOI: https://dx.doi.org/10.3748/wjg.v21.i35.10166


