Copyright
©The Author(s) 2015.
World J Gastroenterol. Apr 14, 2015; 21(14): 4293-4301
Published online Apr 14, 2015. doi: 10.3748/wjg.v21.i14.4293
Published online Apr 14, 2015. doi: 10.3748/wjg.v21.i14.4293
Figure 1 Agarose gel electrophoresis results from polymerase chain reaction.
Lane 1, DNA marker; lane 2, positive control (Escherichia coli), lanes 3 to 8 and approximately 545 bp band corresponding to lane 3, Escherichia coli; lane 4, Staphylococcus aureus; lane 5, Klebsiellapneumoniae; lane 6, Staphylococcus epidermidis; lane 7, Streptococcus pneumoniae; lane 8, Enterococcus faecalis; lane 9 to 10, negative controls.
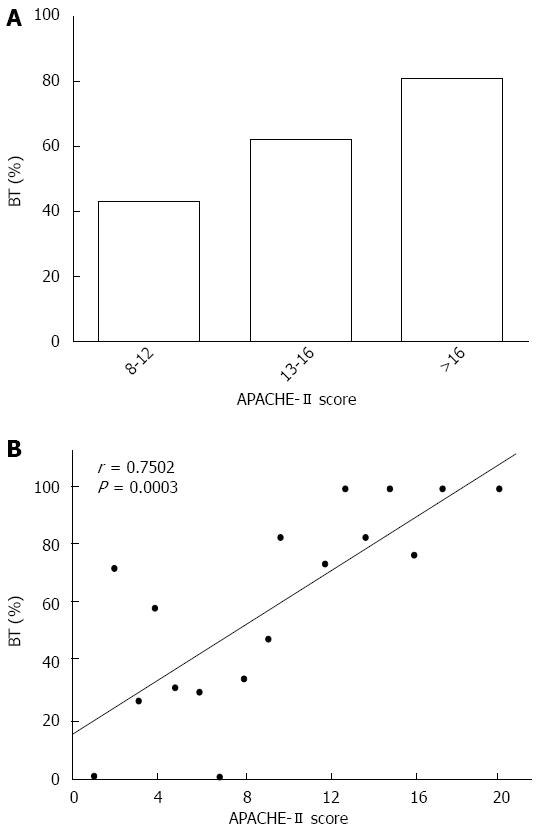
Figure 2 Percentage of bacterial translocation among patients with different severities of illness (A) and the prevalence of bacteremia was positively correlated with the APACHE-II score in patients with severe acute pancreatitis.
A: According to the APACHE-II score; B: r = 0.7502, P < 0.0001 vs control. APACHE: Acute Physiology and Chronic Health Evaluation.
Figure 3 Expression of Arpin and tight junction proteins in the colonic mucosa of SAP-BT (-) patients and SAP-BT (+) patients (representative immunoblot).
SAP: Severe acute pancreatitis; BT: Bacterial translocation.
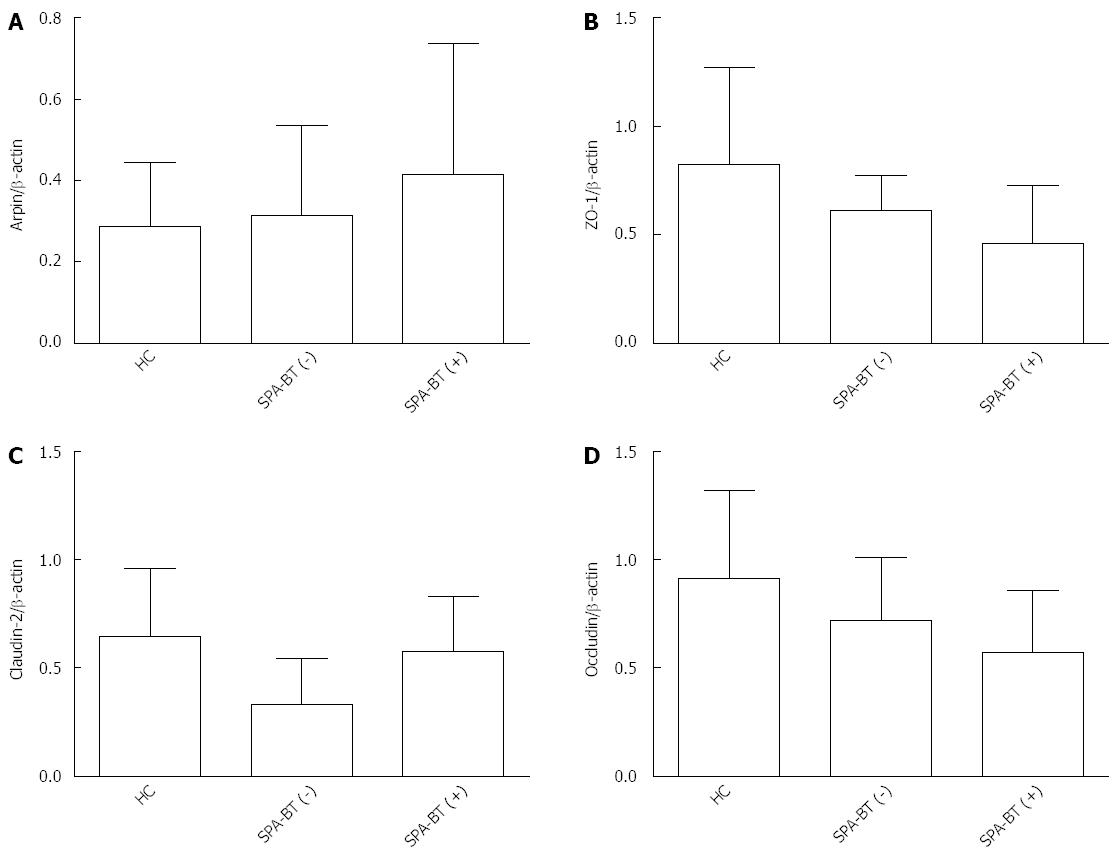
Figure 4 Arpin and tight junction proteins expression.
A: Arpin expression; HC vs SAP-BT (-), P = 0.325; HC vs SAP-BT (+), P = 0.015; B: Zonula occludens-2 expression; HC vs SAP-BT (-), P = 0.012; HC vs SAP-BT(+), P = 0.023; C: Claudin-2 expression; HC vs SAP-BT (-), P = 0.032; HC vs SAP-BT (+), P = 0.027; D: Occludin expression; HC vs SAP-BT (-), P = 0.038; HC vs SAP-BT (+), P = 0.019. All performed one-way ANOVA. SAP: Severe acute pancreatitis; BT: Bacterial translocation; HC: Healthy control.
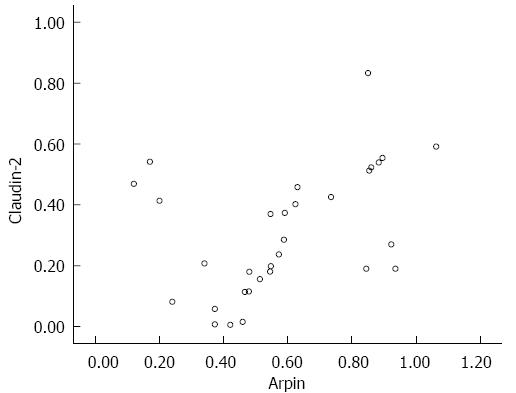
Figure 5 Relationship between Arpin and claudin-2 expression in severe acute pancreatitis-BT (+) patients.
Pearson test, r = 0.421, P =0.003. BT: Bacterial translocation.
- Citation: Deng WS, Zhang J, Ju H, Zheng HM, Wang J, Wang S, Zhang DL. Arpin contributes to bacterial translocation and development of severe acute pancreatitis. World J Gastroenterol 2015; 21(14): 4293-4301
- URL: https://www.wjgnet.com/1007-9327/full/v21/i14/4293.htm
- DOI: https://dx.doi.org/10.3748/wjg.v21.i14.4293


