Copyright
©2014 Baishideng Publishing Group Co.
World J Gastroenterol. May 7, 2014; 20(17): 5000-5007
Published online May 7, 2014. doi: 10.3748/wjg.v20.i17.5000
Published online May 7, 2014. doi: 10.3748/wjg.v20.i17.5000
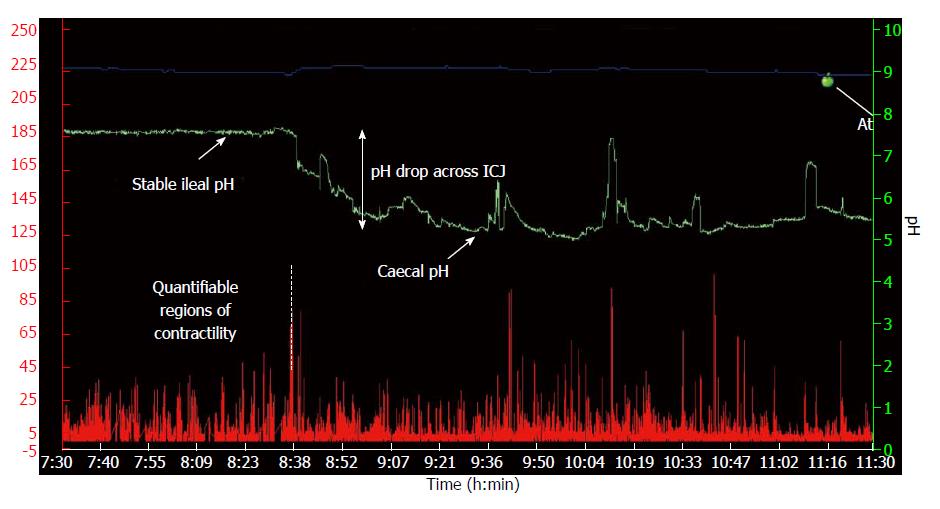
Figure 1 A typical wireless motility capsule trace demonstrating temperature (blue line), pH (green line) and contractility (red line) across the ileo-caecal junction.
The pH drop was defined as the difference between the stable ileal pH and the caecal pH nadir. ICJ: Ileo-caecal junction.
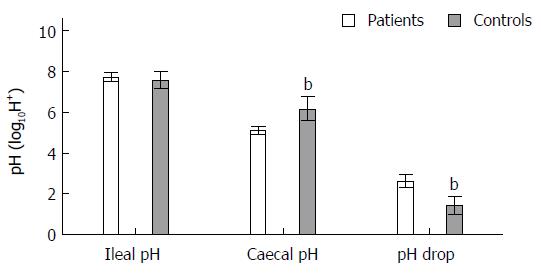
Figure 2 Differences (mean ± SD) in ileal, caecal and ileo-caecal junction pH drop between patients and controls.
Caecal pH significantly lower in patients than in controls and pH drop across the ICJ was lower in patients than in controls. bP < 0.01 vs patients group. ICJ: Ileo-caecal junction.
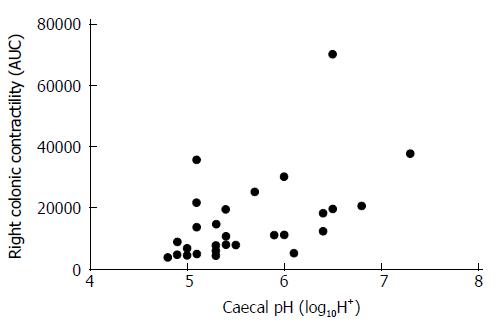
Figure 3 Caecal pH and caecal contractility was positively correlated (r = 0.
54, P = 0.002). AUC: Area under the curve.
- Citation: Farmer AD, Mohammed SD, Dukes GE, Scott SM, Hobson AR. Caecal pH is a biomarker of excessive colonic fermentation. World J Gastroenterol 2014; 20(17): 5000-5007
- URL: https://www.wjgnet.com/1007-9327/full/v20/i17/5000.htm
- DOI: https://dx.doi.org/10.3748/wjg.v20.i17.5000


