Copyright
©The Author(s) 1996.
World J Gastroenterol. Mar 25, 1996; 2(1): 44-50
Published online Mar 25, 1996. doi: 10.3748/wjg.v2.i1.44
Published online Mar 25, 1996. doi: 10.3748/wjg.v2.i1.44
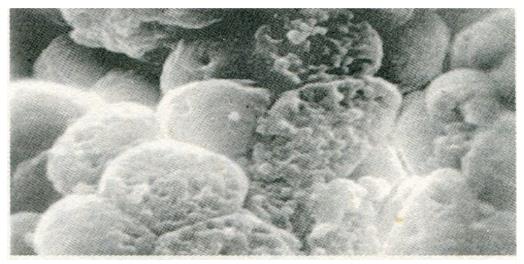
Figure 1 Focal superficial inflammation, partial rupture of the epithelial cytomembrane, and exposure of the cytoplasmic granule.
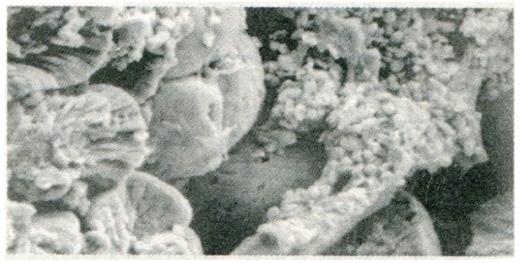
Figure 2 Focal intestinal metaplasia, with microvilli outside of cells, unclear intracellular granules and partial degradation of epithelial cells.
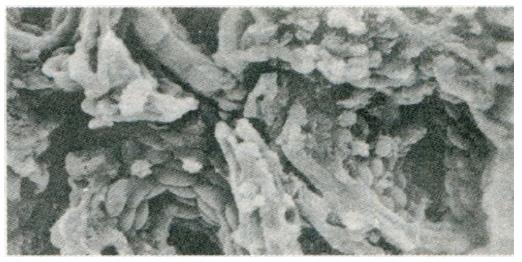
Figure 3 Focal atrophic inflammation, with a large area of cells with maintained contour but with ruptured cytomembranes and exposed cytoplasmic granules.
There were only a few red blood cells present.
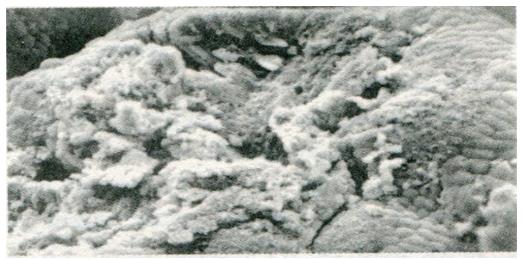
Figure 4 Micro-ulcer, with mucosa scaled in the ulcer area, clear granule and normal cells in the periphery.
There was a small amount of red blood cells and white blood cells present.
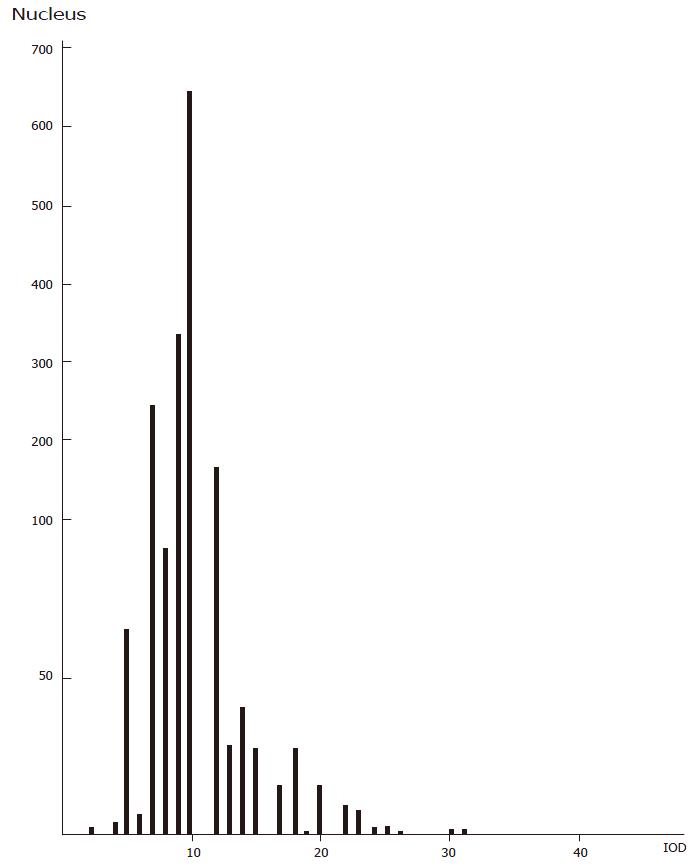
Figure 5 Distribution histogram of DNA levels in gastric mucosa from 15 cases of benign gastric disease due to deficiency of spleen energy.
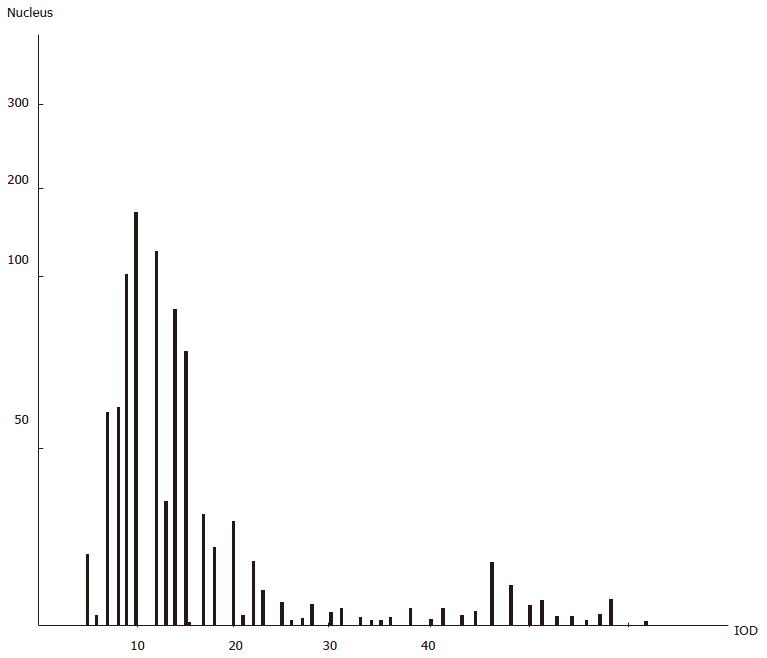
Figure 6 Distribution histogram of DNA levels in gastric mucosa from 9 cases of benign gastric disease due to spleen deficiency with energy stagnation.
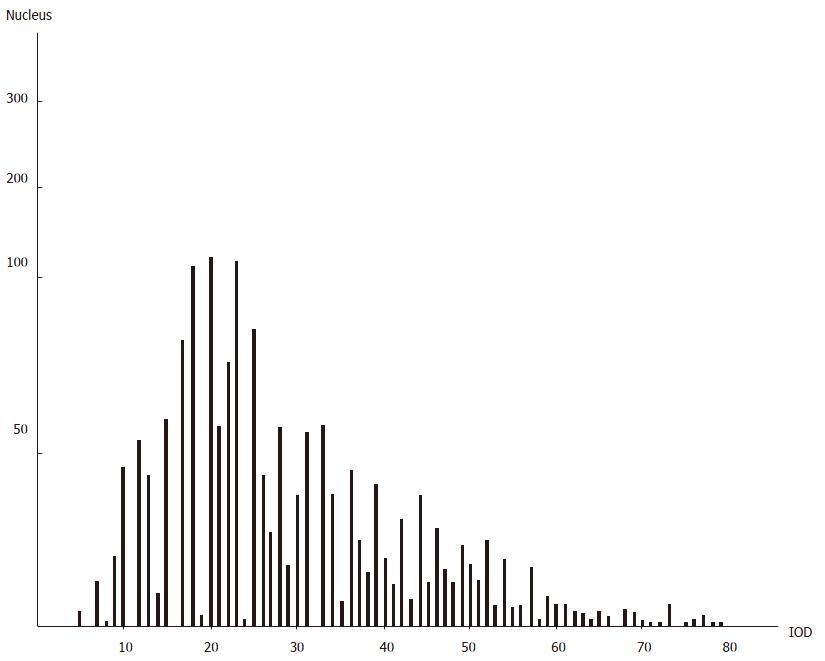
Figure 7 Distribution histogram of DNA levels in gastric mucosa from 11 cases of gastric cancer.
- Citation: Guang-Yao Y, Fen-Xue H, Fen YY. Clinical and experimental study on gastric mucosal pathology, gene expression, cAMP and trace elements of pixu patients. World J Gastroenterol 1996; 2(1): 44-50
- URL: https://www.wjgnet.com/1007-9327/full/v2/i1/44.htm
- DOI: https://dx.doi.org/10.3748/wjg.v2.i1.44


