Copyright
©2013 Baishideng Publishing Group Co.
World J Gastroenterol. Feb 28, 2013; 19(8): 1306-1313
Published online Feb 28, 2013. doi: 10.3748/wjg.v19.i8.1306
Published online Feb 28, 2013. doi: 10.3748/wjg.v19.i8.1306
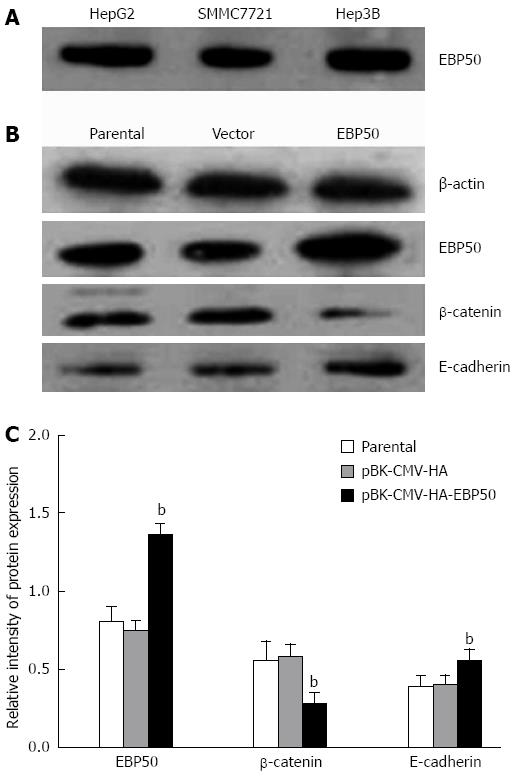
Figure 1 Ezrin-radixin-moesin-binding phosphoprotein-50, β-catenin, and E-cadherinprotein levels were detected with Western blotting.
A: The expression of ezrin-radixin-moesin-binding phosphoprotein-50 (EBP50) protein in Hep3B, SMMC7721, HepG2; B: Western blotting analysis of EBP50, β-catenin, and E-cadherinprotein protein before and after transfection; C: Analysis of the expression of proteins. bP < 0.01 vs parental or pBK-CMV-HA.
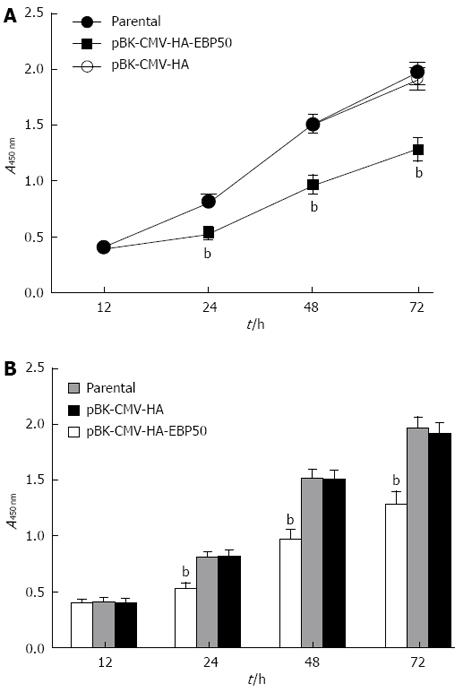
Figure 2 Growth rate comparison of parental, pBK-CMV-HA-EBP50, pBK-CMV-HA cells with a Cell Counting Kit-8 assay.
A: Growth rate comparison of parental, pBK-CMV-HA-EBP50, pBK-CMV-HA cells; B: Analysis of the growth rate. bP < 0.01 vs parental or pBK-CMV-HA.
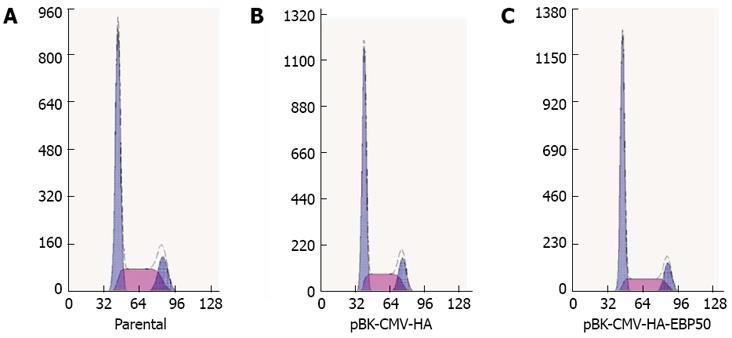
Figure 3 Effect of ezrin-radixin-moesin-binding phosphoprotein-50 over-expression on cell cycle distribution.
A: Cell cycle analysis of parental (G0/G1, 54.2%); B: pBK-CMV-HA (G0/G1, 56.2%); C: pBK-CMV-HA-EBP50 (G0⁄G1, 61.4%) cells with flowcytometry.
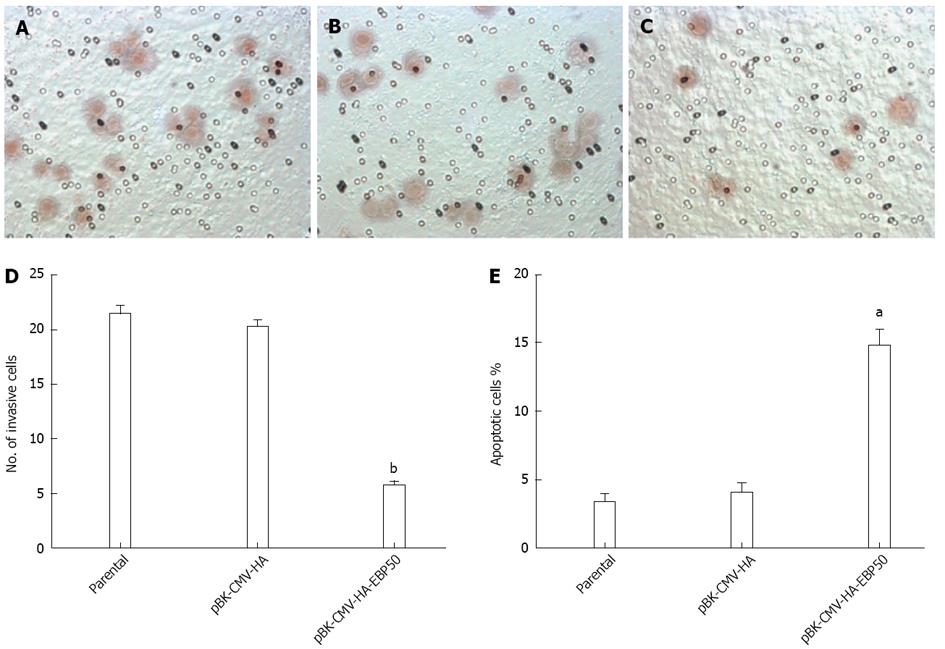
Figure 4 Ezrin-radixin-moesin-binding phosphoprotein-50 over-expression suppressed the migration and invasion of cancer cells.
A: Migration and invasion analysis of parental (21.6 ± 1.3 cells/HP); B: pBK-CMV-HA (20.4 ± 1.1 cells/HP); C: pBK-CMV-HA-EBP50 (5.8 ± 0.8 cells/HP) cells with transwell assey; D: Analysis of the number of invasive cells; E: Apoptotic analysis of parental (3.4% ± 1.3%), pBK-CMV-HA (4.1% ± 1.5%) and pBK-CMV-HA-EBP50 (14.8% ± 2.7%) cells with flowcytometry. aP < 0.05, bP < 0.01 vs parental or pBK-CMV-HA.
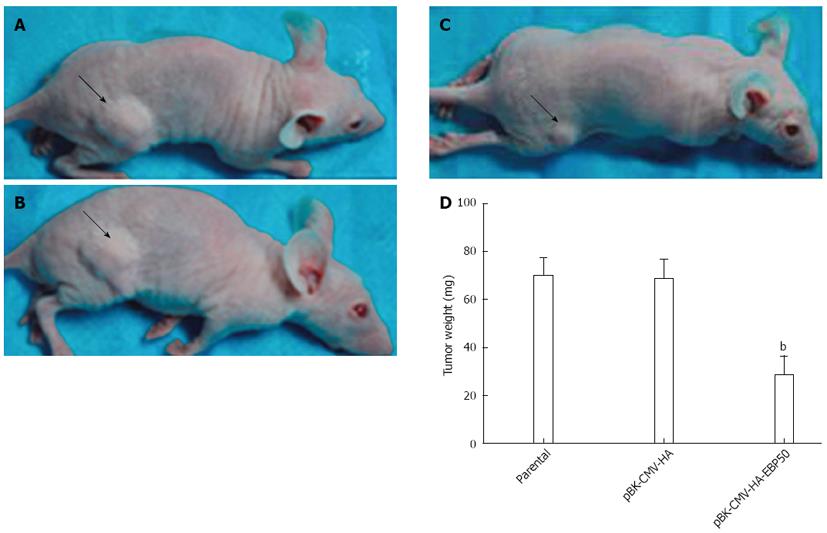
Figure 5 Tumorigenicity was inhibited by overexpression of ezrin-radixin-moesin-binding phosphoprotein-50 ex vivo (arrow).
A: Tumor weight in nude mice of parental (70.1 ± 7.2 mg); B: pBK-CMV-HA (68.9 ± 7.9 mg); C: pBK-CMV-HA-EBP50 (28.9 ± 7.2 mg); D: Tumor weight of the nude mice in each group. bP < 0.01 vs parental or pBK-CMV-HA.
- Citation: Peng XL, Ji MY, Yang ZR, Song J, Dong WG. Tumor suppressor function of ezrin-radixin-moesin-binding phosphoprotein-50 through β-catenin/E-cadherin pathway in human hepatocellular cancer. World J Gastroenterol 2013; 19(8): 1306-1313
- URL: https://www.wjgnet.com/1007-9327/full/v19/i8/1306.htm
- DOI: https://dx.doi.org/10.3748/wjg.v19.i8.1306


