Copyright
©2012 Baishideng Publishing Group Co.
World J Gastroenterol. Jul 28, 2012; 18(28): 3727-3731
Published online Jul 28, 2012. doi: 10.3748/wjg.v18.i28.3727
Published online Jul 28, 2012. doi: 10.3748/wjg.v18.i28.3727
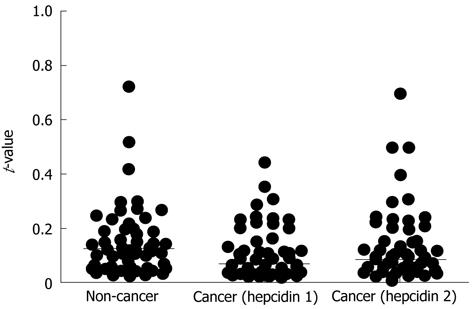
Figure 1 Expression of hepcidin mRNA in hepatocellular carcinoma.
Expression of hepcidin mRNA, extracted from paraffin-embedded sections, was suppressed in cancer tissue. The median t-values for non-cancer, and cancer tissues with hepcidin 1 and hepcidin 2 primers, were 0.124 (0.021-3.433), 0.067 (0.009-2.063), and 0.0825 (0.007-2.1), respectively. The t-values for cancer tissues were significantly higher than that for non-cancer tissues (P = 0.0057).
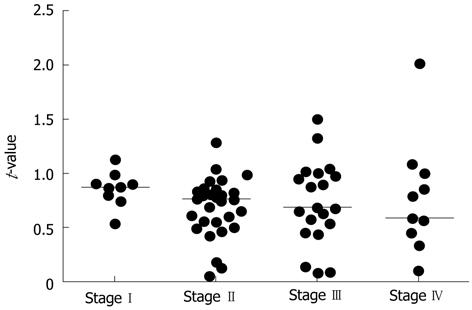
Figure 2 Ratio of hepcidin expression in non-cancer relative to cancer tissues, according to tumor stage.
The median t-values for stages I, II, III and IV were 0.874 (0.537-1.127), 0.754 (0.052-1.286), 0.678 (0.069-1.494), and 0.579 (0.090-2.013), respectively (P = 0.3381, one-way analysis of variance).
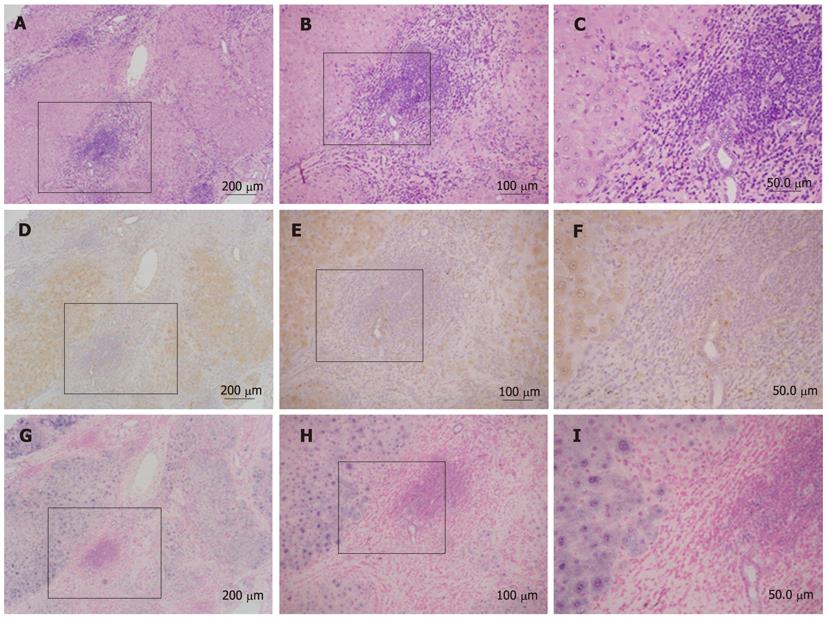
Figure 3 In situ hybridization for hepcidin.
A surgical specimen was stained with hematoxylin-eosin (A: × 100, B: × 200, C: × 400), and also subjected to immunohistochemistry (D: × 100, E: × 200, F: × 400) and in situ hybridization (G: × 100, H: × 200, I: × 400). Hematoxylin-eosin staining shows cancer tissues surrounded by non-cancerous hepatic lobules. Immunohistochemistry shows positive staining for hepcidin in the non-cancerous hepatic lobules (indicated as yellow in the figures). In situ hybridization for hepcidin shows clear expression of hepcidin mRNA in non-cancerous tissues (blue in the figures). Squares represent magnified areas.
-
Citation: Sakuraoka Y, Sawada T, Shiraki T, Park K, Sakurai Y, Tomosugi N, Kubota K. Analysis of hepcidin expression:
In situ hybridization and quantitative polymerase chain reaction from paraffin sections. World J Gastroenterol 2012; 18(28): 3727-3731 - URL: https://www.wjgnet.com/1007-9327/full/v18/i28/3727.htm
- DOI: https://dx.doi.org/10.3748/wjg.v18.i28.3727


