Copyright
©2012 Baishideng Publishing Group Co.
World J Gastroenterol. May 7, 2012; 18(17): 2026-2034
Published online May 7, 2012. doi: 10.3748/wjg.v18.i17.2026
Published online May 7, 2012. doi: 10.3748/wjg.v18.i17.2026
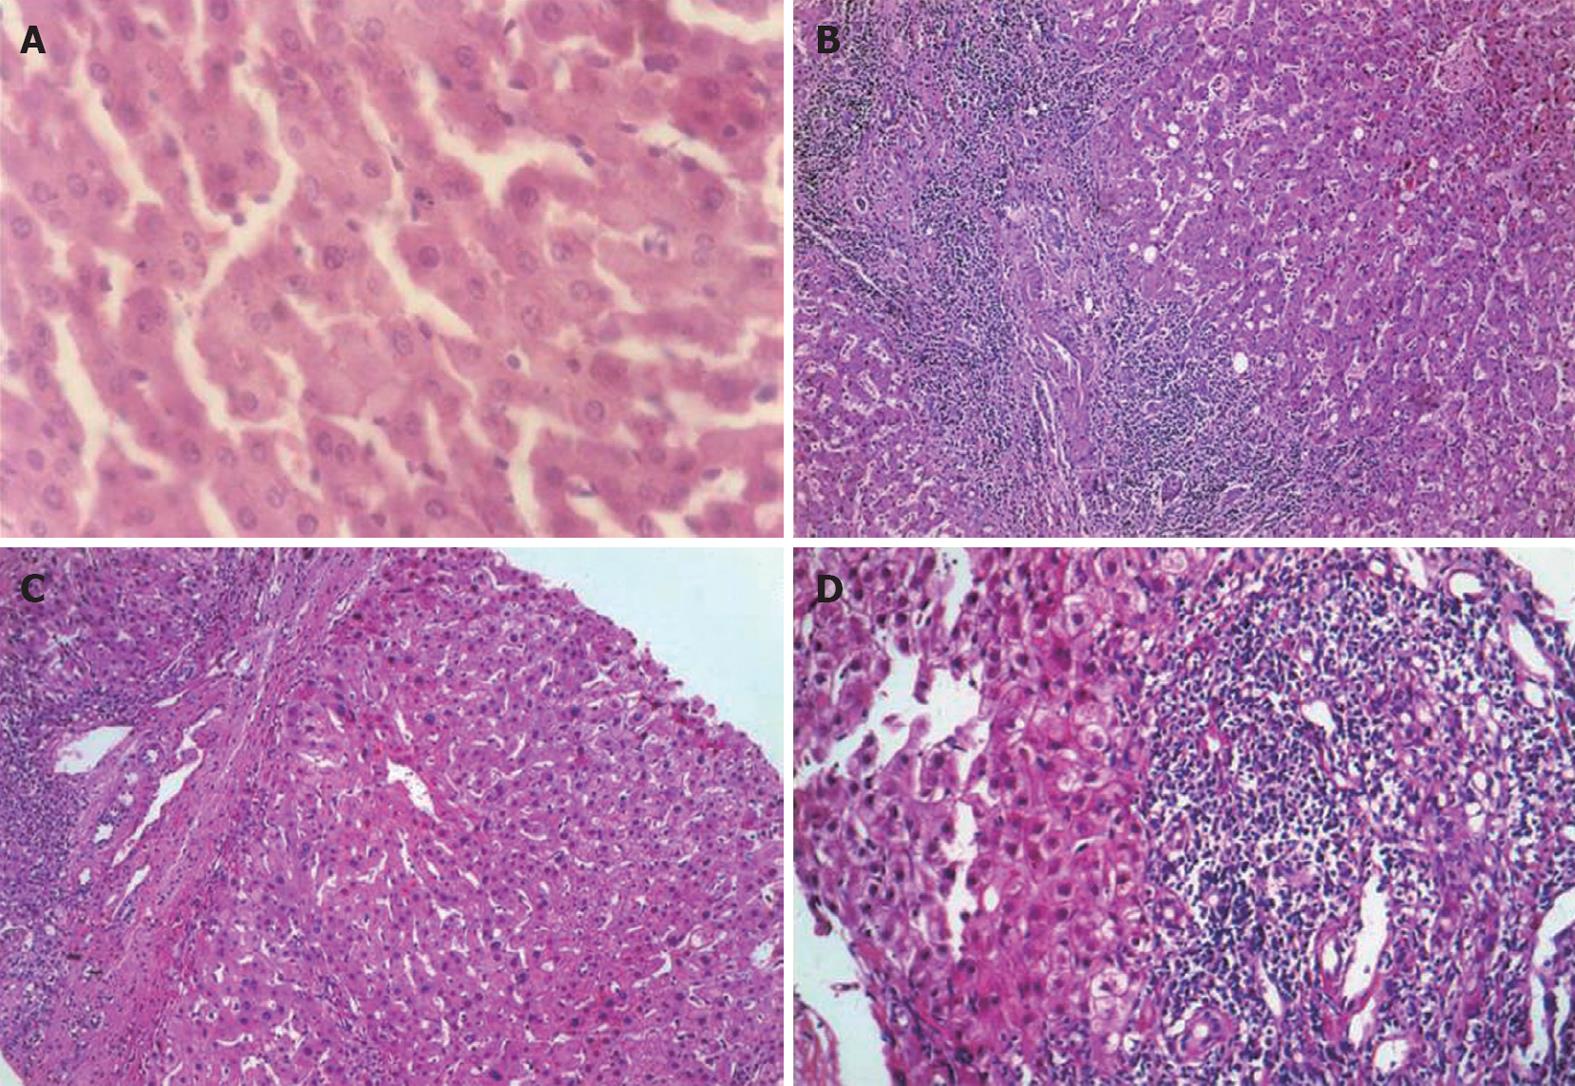
Figure 1 Hematoxylin and eosin staining of liver tissues (HE, × 200).
A: Control group showed normal lobular architecture and cell structure; B: Patients before treatment showed fibro-proliferated bile ductules, thick fibrous septa and dense inflammatory cellular infiltration; C: The conventional group showed moderate fibrosis with inflammatory infiltration and slight ballooning of liver cells; D: Aloe vera high molecular weight fractions group showed minimal infiltration and minimal fibrosis.
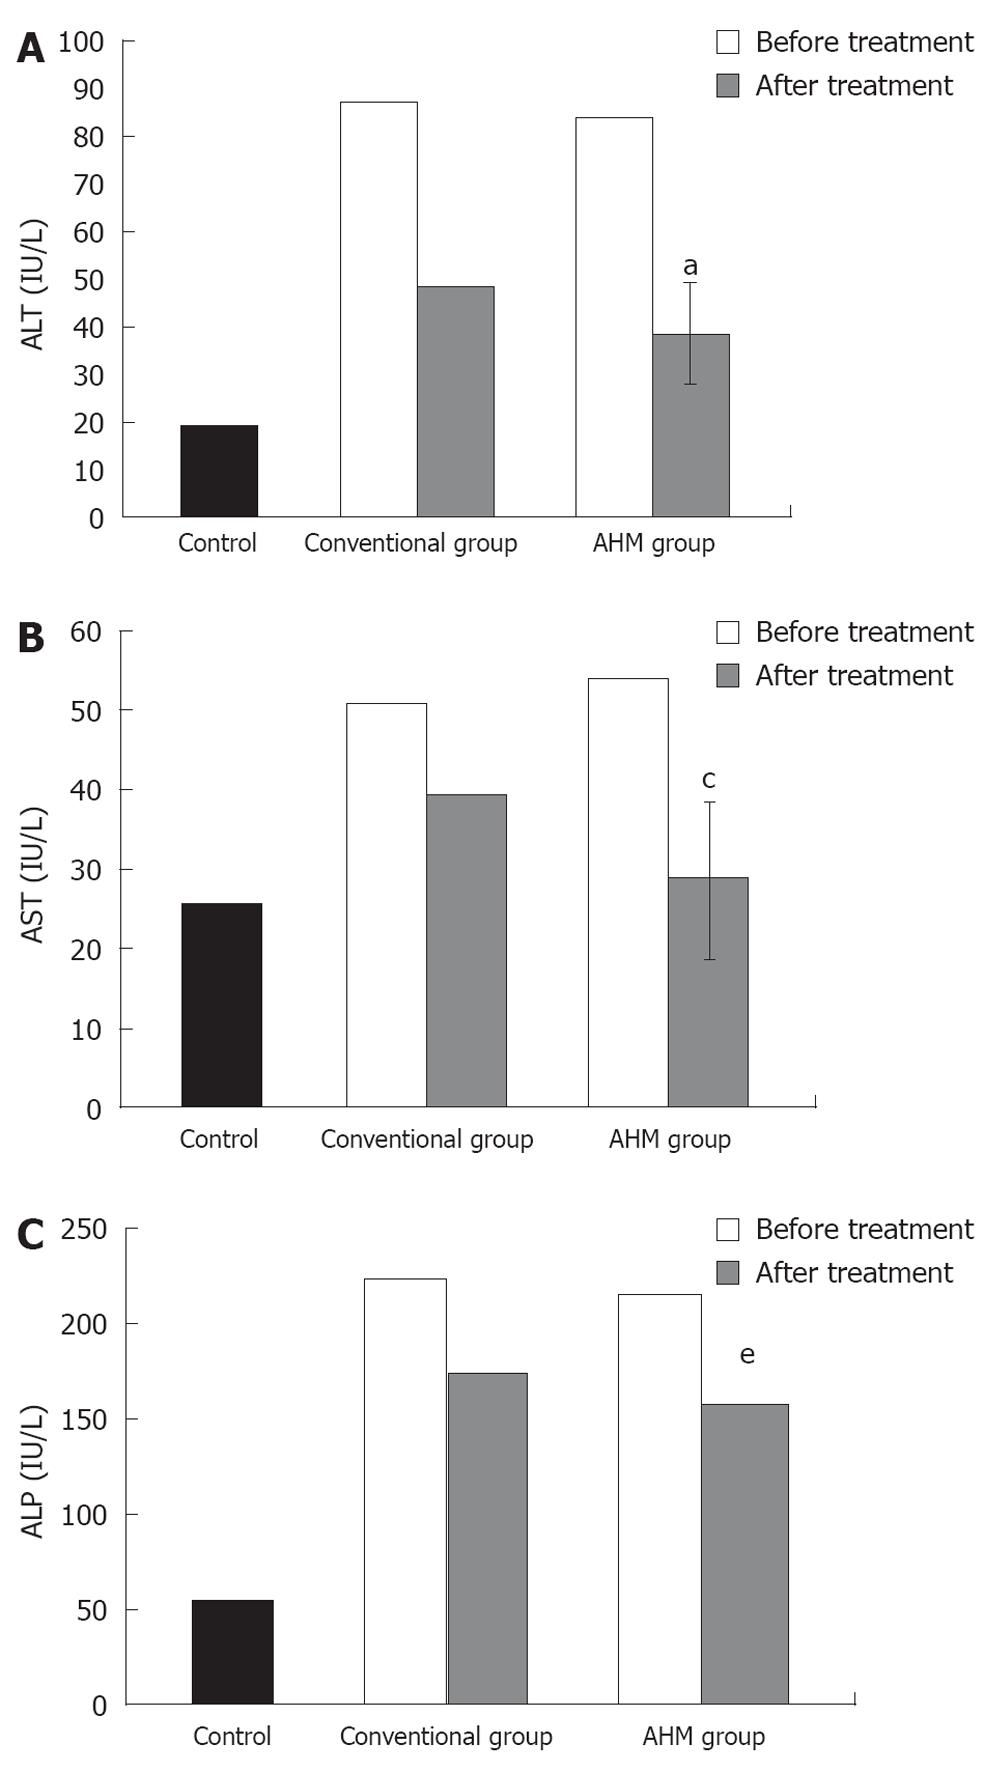
Figure 2 Serum activity of alanine aminotransferase, alkaline phosphatase and aspartate aminotransferase of hepatic fibrosis patients and controls.
A: Serum activity of alanine aminotransferase (IU/L) of hepatic fibrosis patients and controls; B: Serum activity of aspartate aminotransferase (IU/L) of hepatic fibrosis patients and controls; C: Serum activity of alkaline phosphatase (IU/L) of hepatic fibrosis patients and controls. aP < 0.05, cP < 0.05, eP < 0.05 vs before treatment and conventional group; Data are presented as mean ± SD. ALT: Alanine aminotransferase; AST: Aspartate aminotransferase; ALP: Alkaline phosphatase; AHM: Aloe vera high molecular weight fractions.
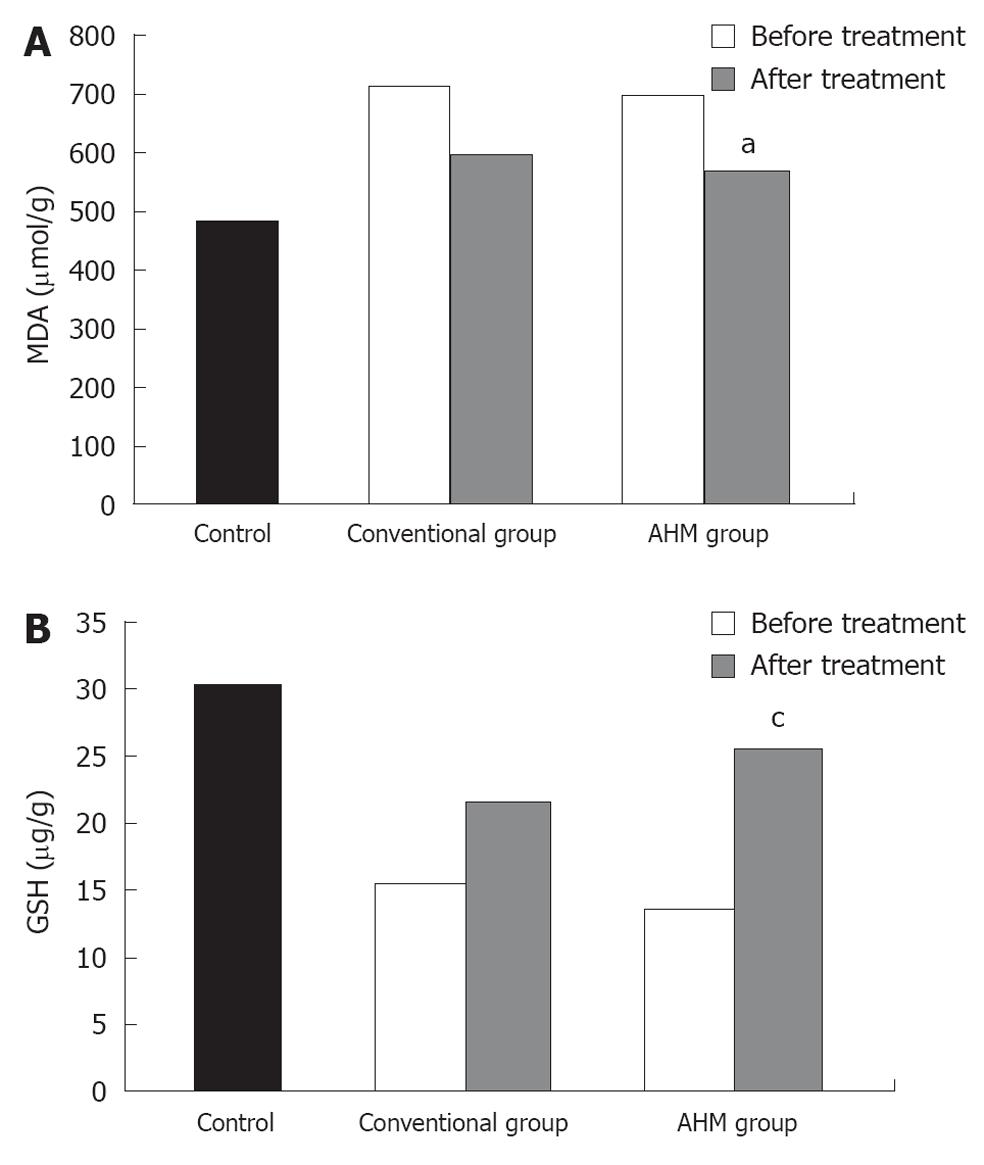
Figure 3 Hepatic malondialdhyde and glutathione of hepatic fibrosis patients and controls.
A: Hepatic malondialdhyde (μmol/g) of hepatic fibrosis patients and controls; B: Hepatic reduced glutathione (μg/g) of hepatic fibrosis patients and controls. aP < 0.05, cP < 0.05 vs before treatment and conventional group. Data are presented as mean ± SD. MDA: Malondialdehyde; GSH: Glutathione; AHM: Aloe vera high molecular weight fractions.
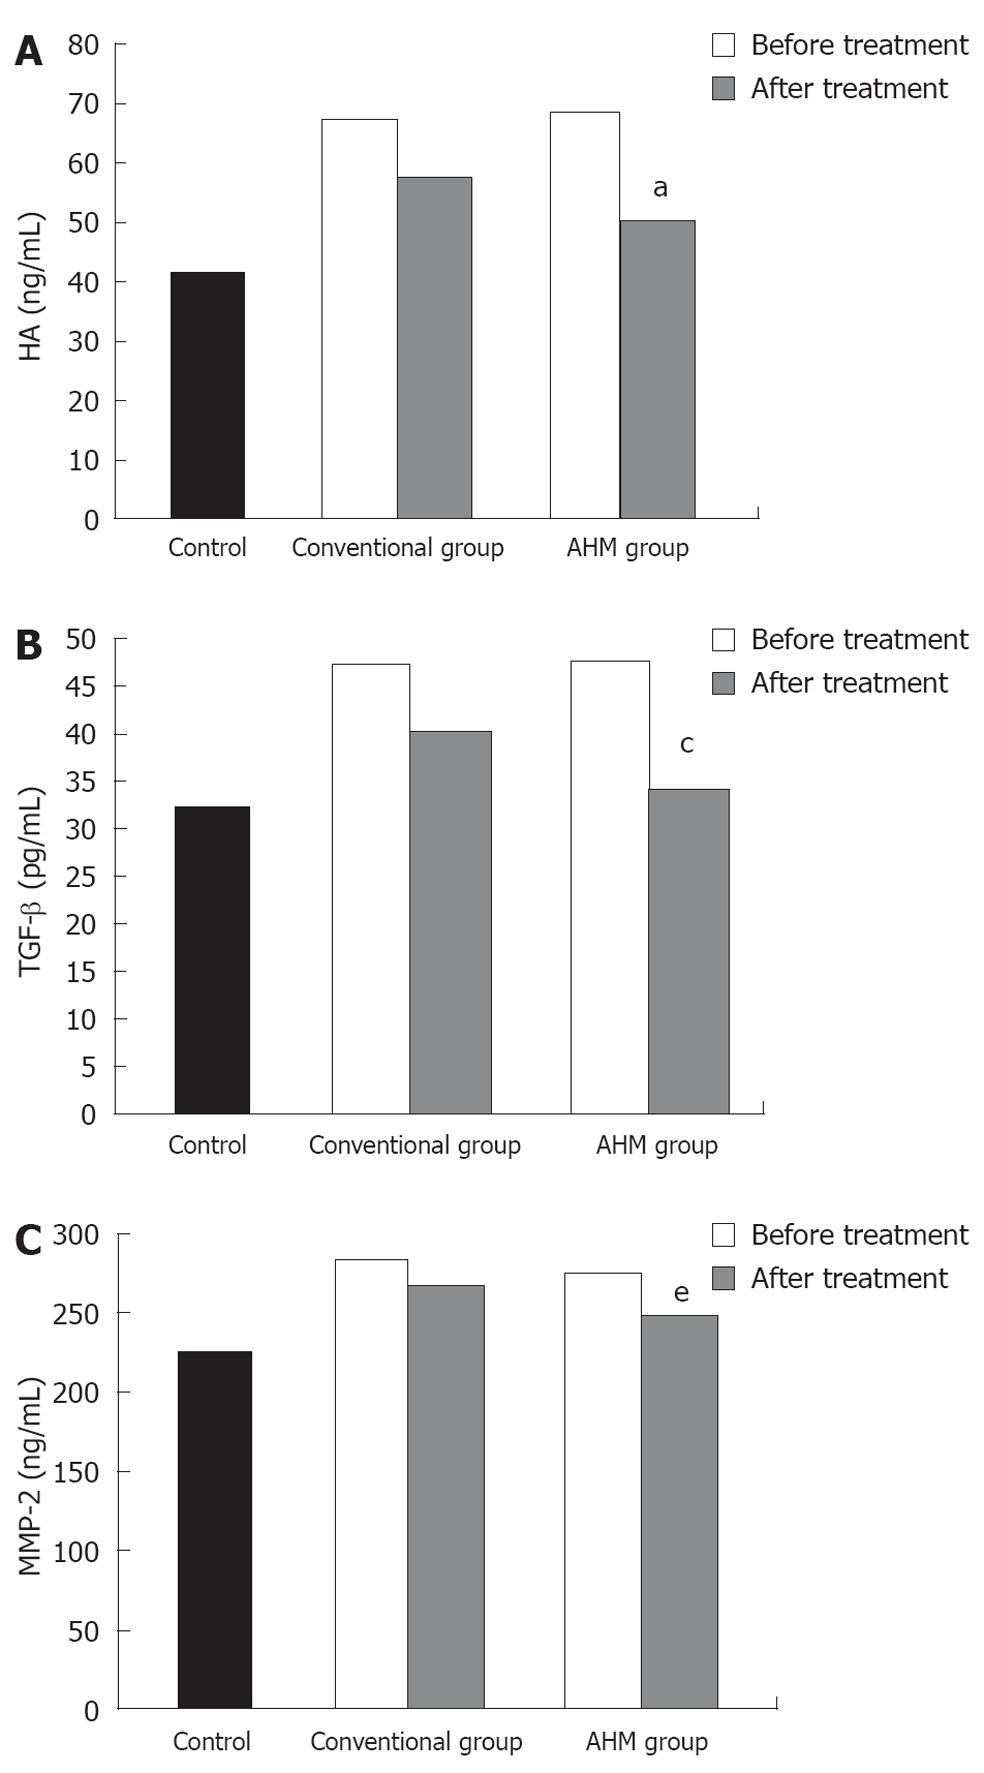
Figure 4 Serum hyaluronic acid, transforming growth factor-β and matrix metalloproteinase-2 of hepatic fibrosis patients and controls.
A: Serum hyaluronic acid (ng/mL) of hepatic fibrosis patients and controls; B: Serum transforming growth factor-β (pg/mL) of hepatic fibrosis patients and controls; C: Serum matrix metalloproteinase-2 (ng/mL) of hepatic fibrosis patients and controls. aP < 0.05, cP < 0.05, eP < 0.05 vs before treatment and conventional group. Data are presented as mean ± SD. HA: Hyaluronic acid; TGF-β: Transforming growth factor-β; MMP-2: Matrixmetalloproteinase-2; AHM: Aloe vera high molecular weight fractions.
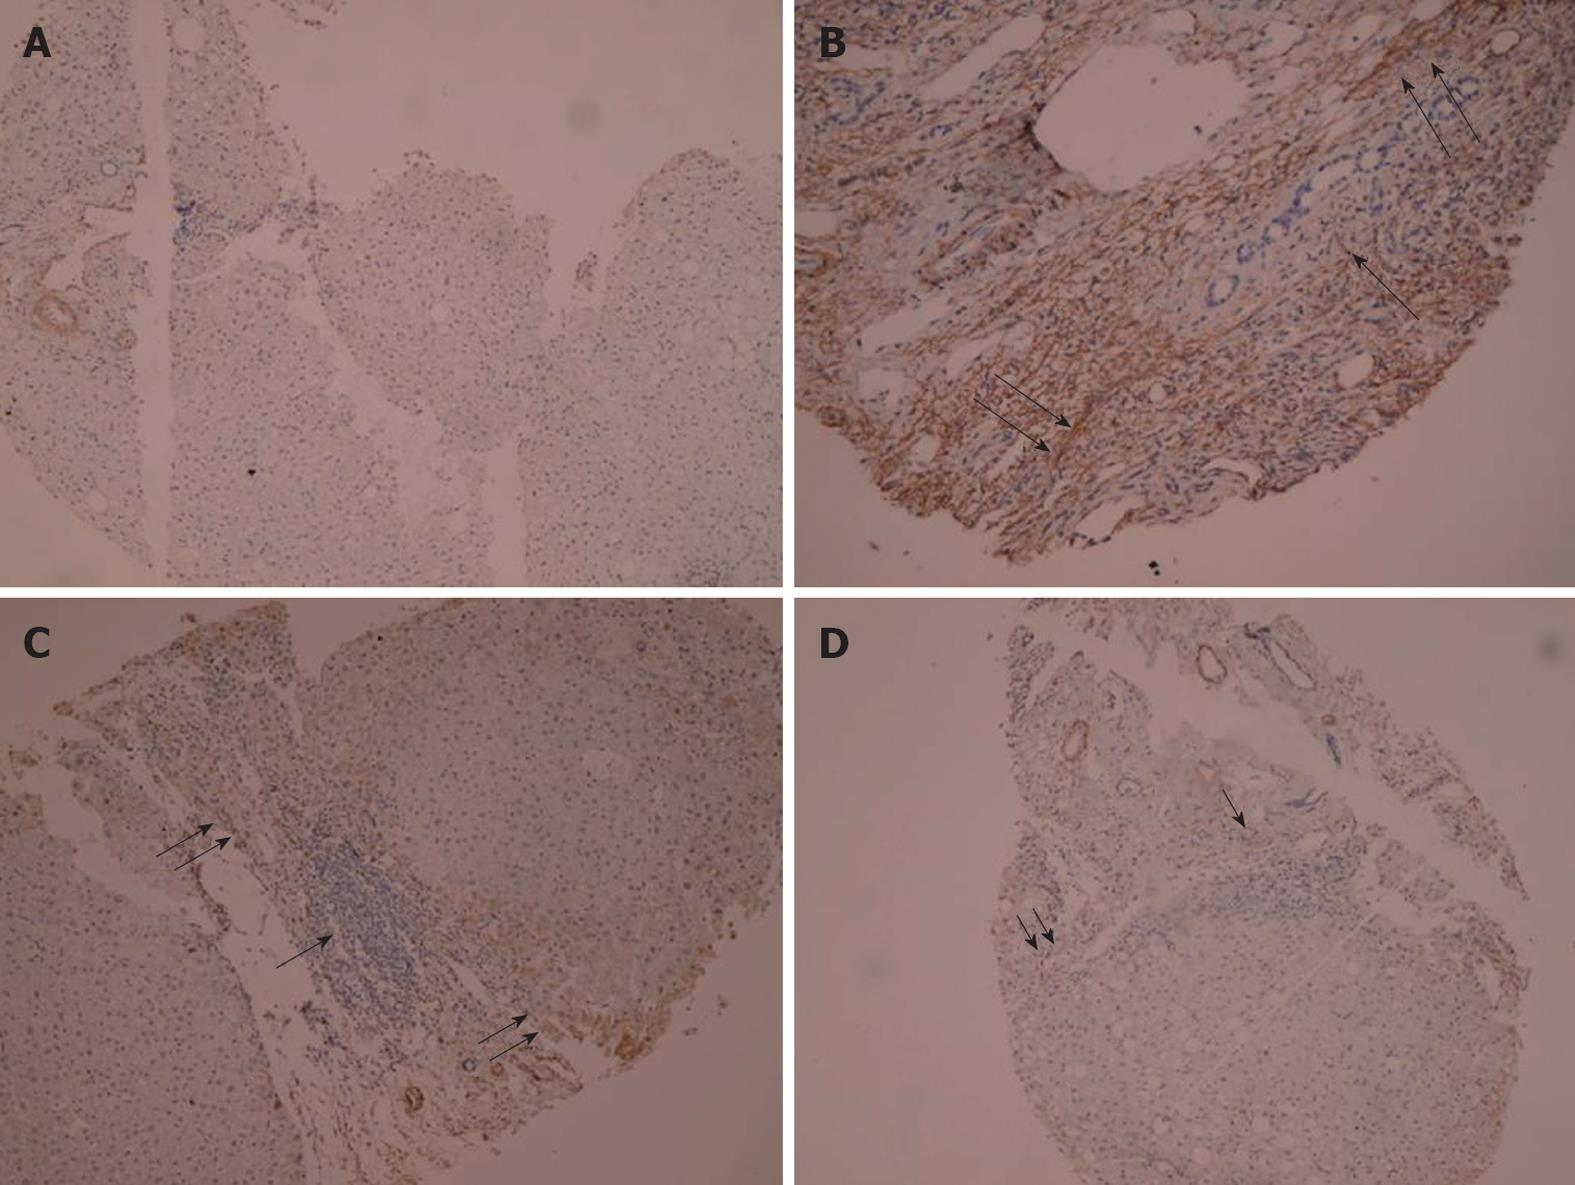
Figure 5 Immunohistochemical staining of α-smooth muscle actin.
A: Section of liver from controls showing negative staining (PAP × 125); B: Section of liver from liver fibrosis patients before treatment showing dense fibrotic reaction with strong positivity for α-smooth muscle actin (α-SMA) ↑↑ and dense mononuclear cellular infiltration ↑ (PAP × 225); C: Section of liver from conventional group after treatment showing dense mononuclear inflammatory infiltration ↑ and moderate positivity for α-SMA in fibrotic lesion↑↑ (PAP × 125); D: Section of liver from AHM group after treatment showing moderate mononuclear cellular infiltration ↑ surrounded by minimal fibrotic reaction stained mildly with α-SMA ↑↑ (PAP × 125).
- Citation: Hegazy SK, El-Bedewy M, Yagi A. Antifibrotic effect of aloe vera in viral infection-induced hepatic periportal fibrosis. World J Gastroenterol 2012; 18(17): 2026-2034
- URL: https://www.wjgnet.com/1007-9327/full/v18/i17/2026.htm
- DOI: https://dx.doi.org/10.3748/wjg.v18.i17.2026


