Copyright
©2011 Baishideng Publishing Group Co.
World J Gastroenterol. Feb 14, 2011; 17(6): 735-742
Published online Feb 14, 2011. doi: 10.3748/wjg.v17.i6.735
Published online Feb 14, 2011. doi: 10.3748/wjg.v17.i6.735
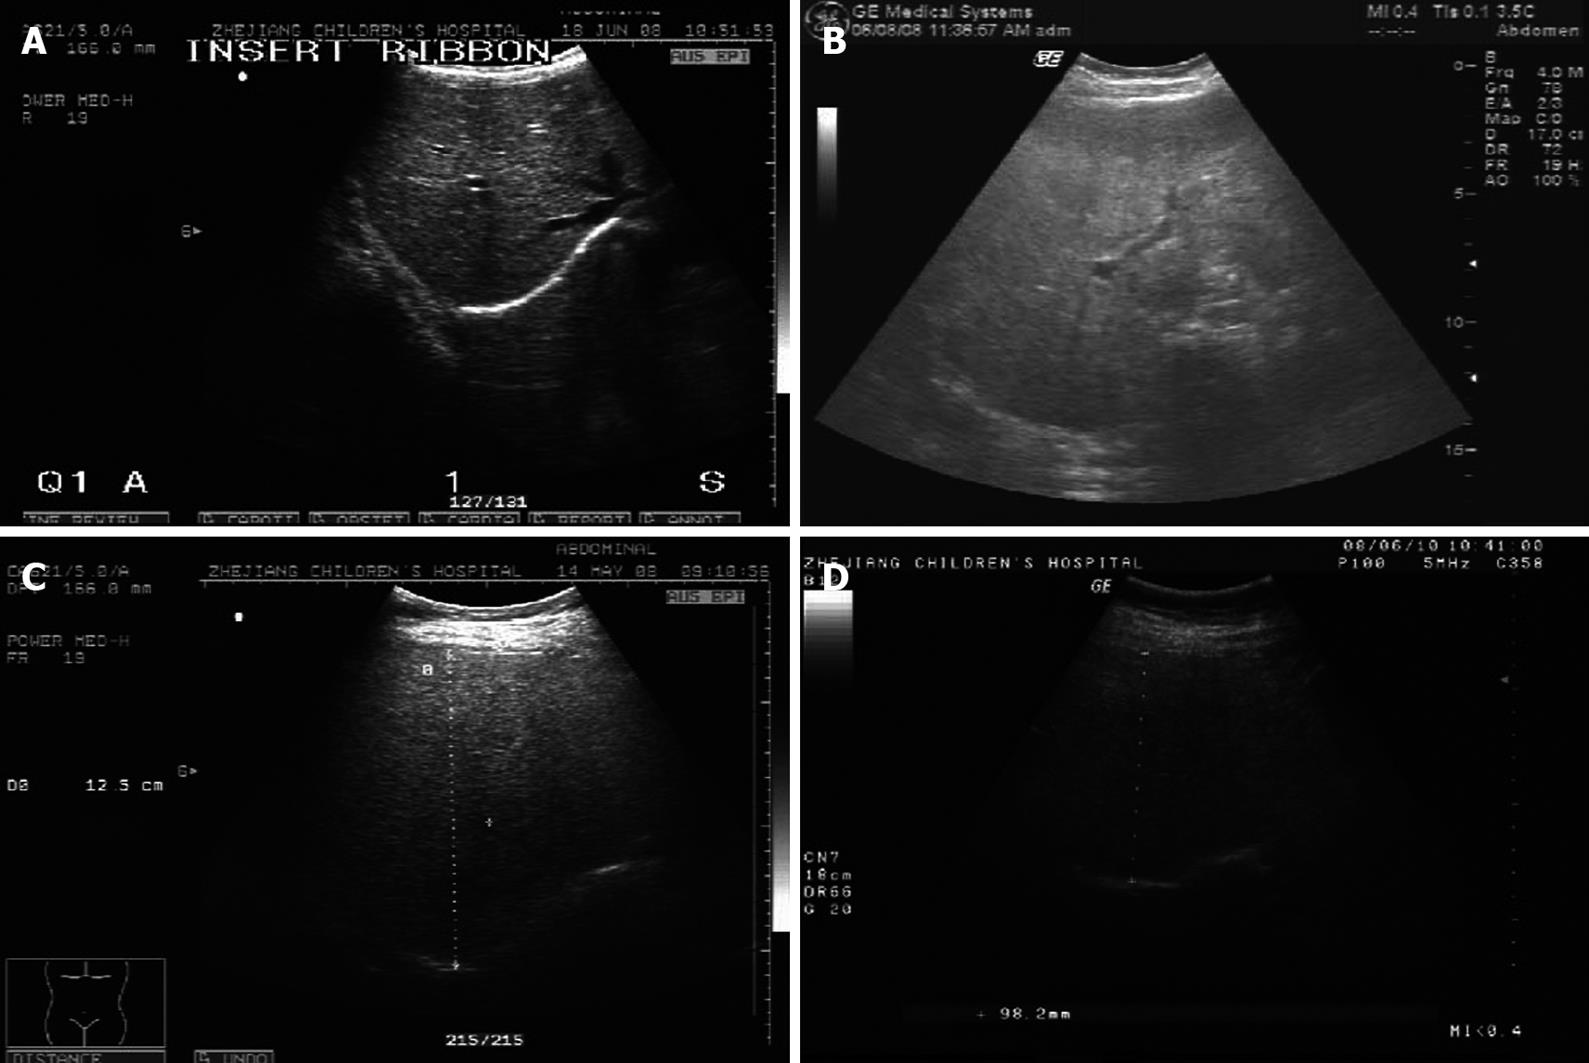
Figure 1 Liver B-ultrasound scans show the panel of four different classes of liver steatosis.
A: Class 0: not observed; B: Class 1: mild, liver-kidney contrast without vascular blurring and deep attenuation; C: Class 2: moderate, liver-kidney contrast with vascular blurring, but no deep attenuation; D: Class 3: severe, combination of liver-kidney contrast with vascular blurring and deep attenuation.
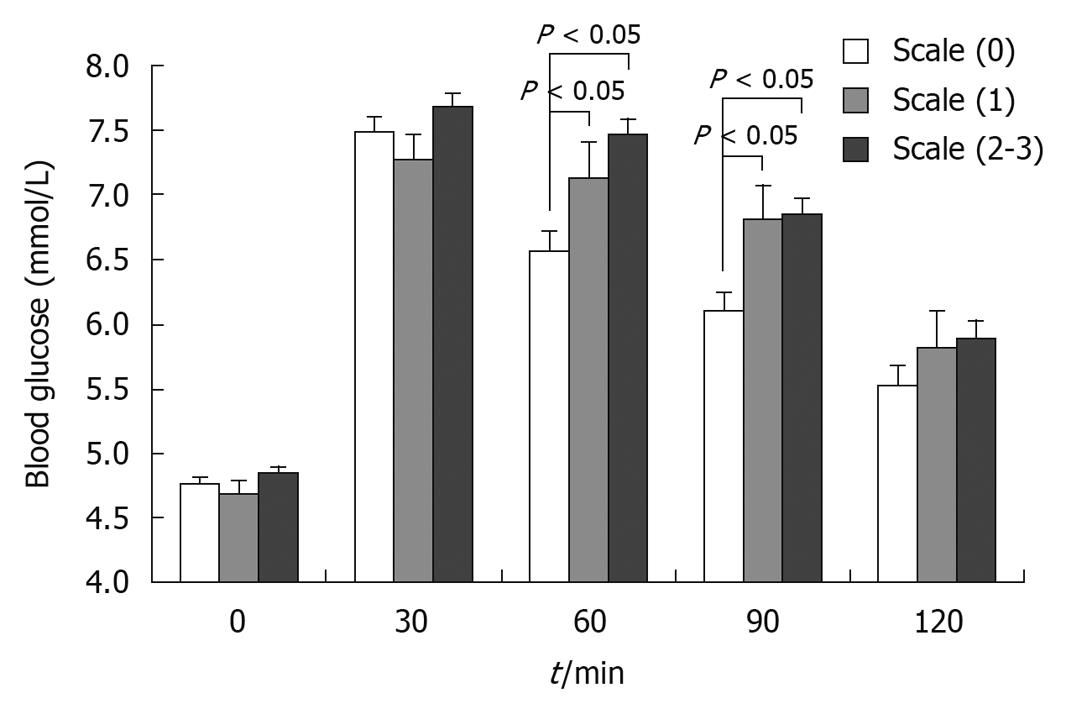
Figure 2 Oral glucose tolerance test in obese patients based on liver B-ultrasound gradings.
When patients were stratified according to the presence of liver fatty infiltration based on the B-ultrasound scans, their glucose levels at 60 min and 90 min after tolerance were significantly higher in classes 1-3 (P < 0.05) than in class 0, but there was no difference between class 1 and classes 2-3 (P > 0.05).
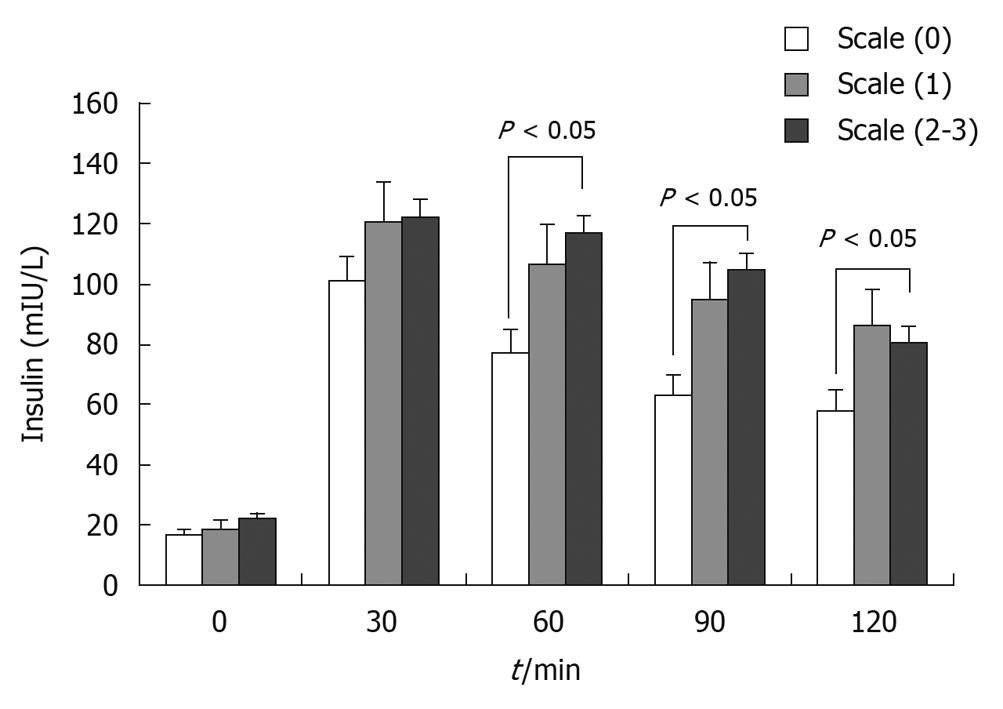
Figure 3 Insulin releasing test in obese patients based on liver B-ultrasound gradings.
There was no difference in fasting insulin among the three groups, but 60, 90 and 120 min insulin levels were markedly increased in the class 2-3 groups compared with class 0 (P < 0.05).
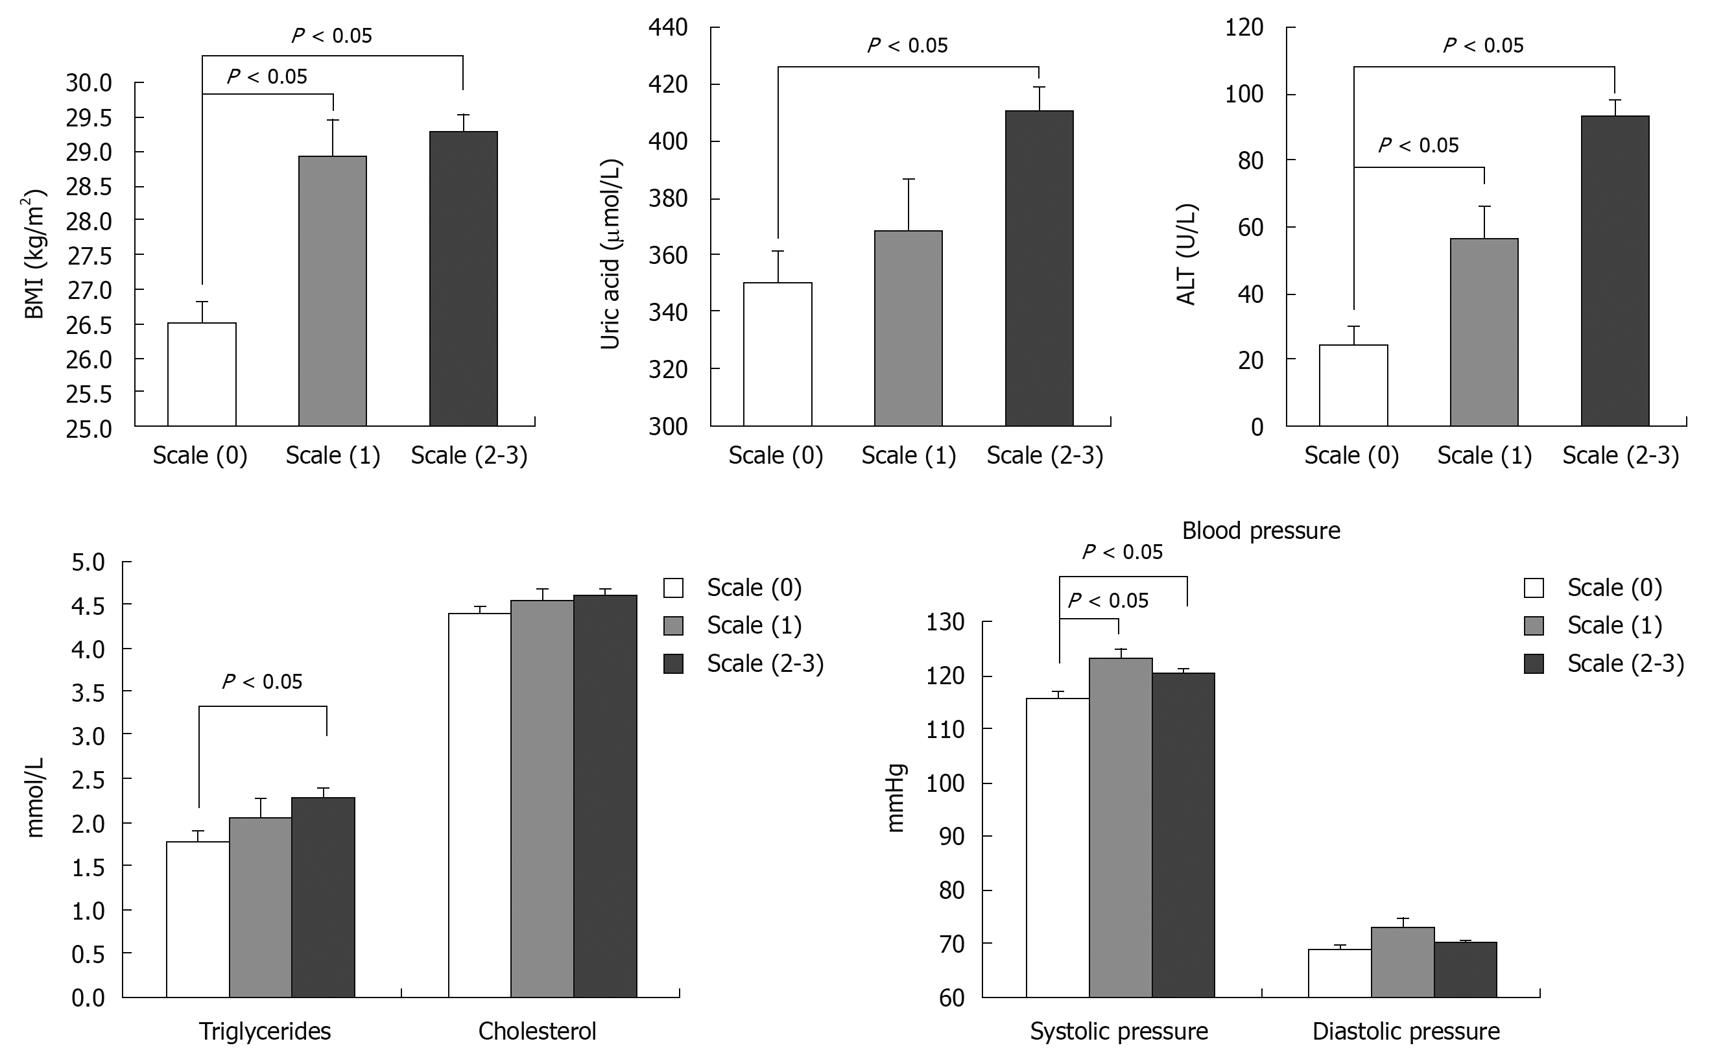
Figure 4 Clinical features of the metabolic syndrome in obese patients based on liver B-ultrasound gradings.
Concerning the individual metabolic component, body mass index (BMI), alanine aminotransferase (ALT) and systolic pressure were significantly higher in class 1 and classes 2-3 compared with class 0 (P < 0.05), but there was no difference between class 1 and classes 2-3 (P > 0.05). The levels of uric acid and triglyceride were only markedly increased in classes 2-3 compared with class 0 (P < 0.05). There was no difference in cholesterol levels among the three groups (P > 0.05).
- Citation: Fu JF, Shi HB, Liu LR, Jiang P, Liang L, Wang CL, Liu XY. Non-alcoholic fatty liver disease: An early mediator predicting metabolic syndrome in obese children? World J Gastroenterol 2011; 17(6): 735-742
- URL: https://www.wjgnet.com/1007-9327/full/v17/i6/735.htm
- DOI: https://dx.doi.org/10.3748/wjg.v17.i6.735


