Copyright
©2011 Baishideng Publishing Group Co.
World J Gastroenterol. Sep 28, 2011; 17(36): 4090-4098
Published online Sep 28, 2011. doi: 10.3748/wjg.v17.i36.4090
Published online Sep 28, 2011. doi: 10.3748/wjg.v17.i36.4090
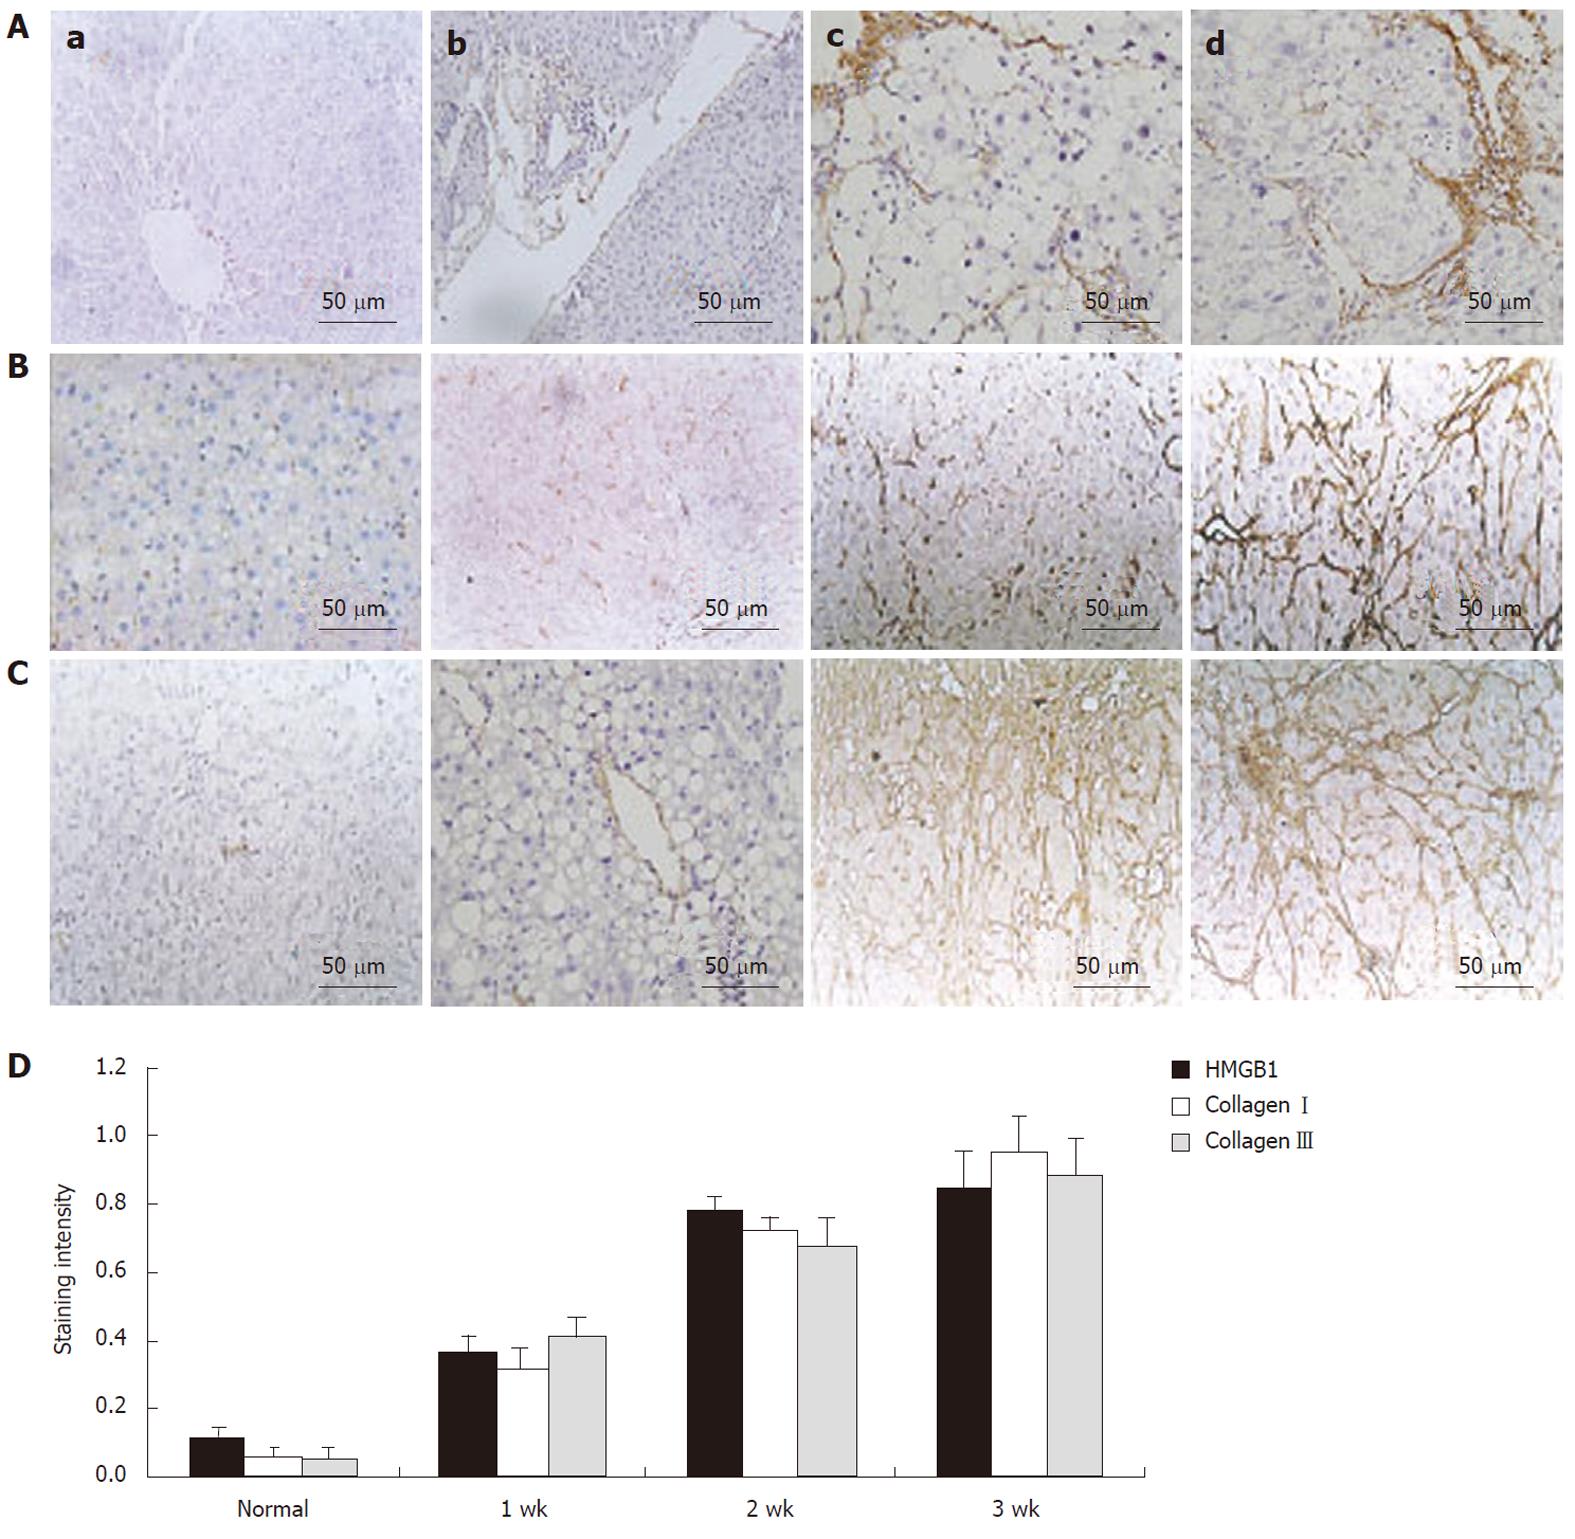
Figure 1 High-mobility group box 1 protein was upregulated after dimethylnitrosamine injection.
A: Immunohistochemical study of high-mobility group box 1 (HMGB1) distribution and expression in liver fibrosis specimens (original magnification, × 400). Brown color displays the positive expression. a: There was no immunoreactivity in the normal liver tissue; b: Weak staining in liver fibrosis tissue at 1 wk after the first dimethylnitrosamine (DMN) injection; c: Moderate staining in liver fibrosis tissue at 2 wk after the first DMN injection; d: Strong staining in liver fibrosis tissue at 3 wk after the first DMN injection; B: Immunohistochemical study of collagen type Iin liver fibrosis specimens (original magnification, × 400). Brown color displays the positive expression. Collagen type I was markedly increased during liver fibrogenesis; C: Immunohistochemical study of collagen type III in liver fibrosis specimens (original magnification, × 400). Brown color displays the positive expression. Collagen type III was markedly increased during liver fibrogenesis; D: The amount of HMGB1, collagen types I and III staining in liver tissue was measured using an image analyzer during liver fibrosis. HMGB1 was markedly increased during liver fibrogenesis, correlated with the expression of collagen types I and III (r = 0.90, P < 0.05 and r = 0.89, P < 0.05).
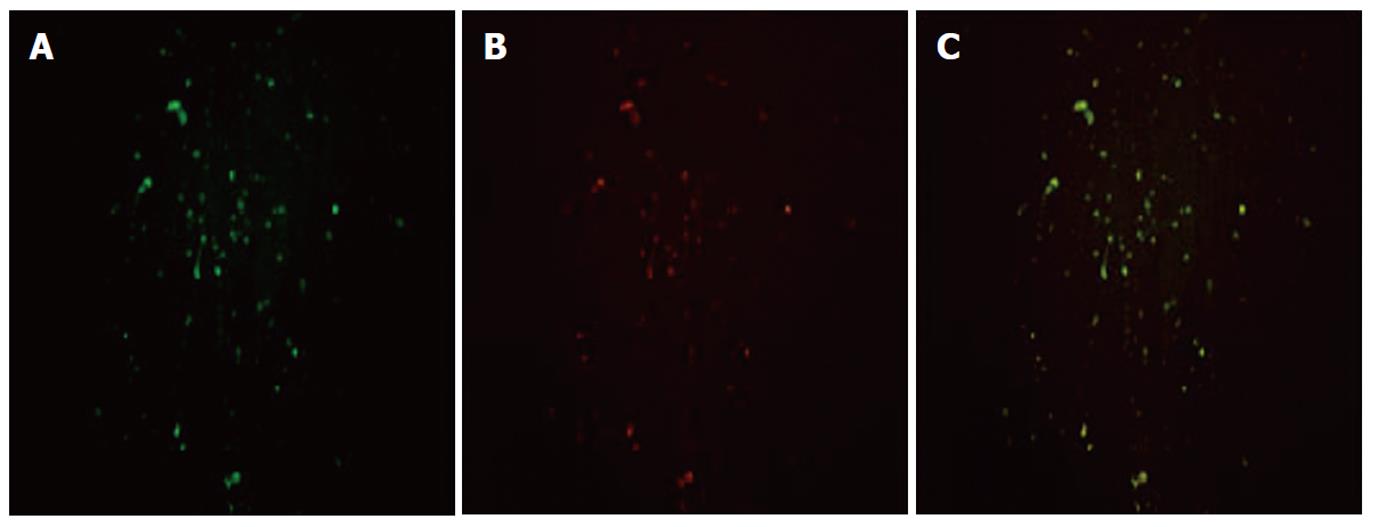
Figure 2 Double immunostaining was used to analyze the cellular localization of high-mobility group box 1 protein and α-smooth muscle actin in hepatic fibrosis tissue (original magnification, × 200).
A: α-smooth muscle actin (α-SMA) was stained with polyclonal α-SMA antibody and secondarily by rhodamine -conjugated anti-rabbit antibody (green); B: High-mobility group box 1 (HMGB1) was stained with monoclonal anti-HMGB1 antibody and secondarily by fluoresceinisothiocyanate-conjugated anti-rabbit antibody (red); C: The yellow areas on the merged image show co-localization of α-SMA and HMGB1.
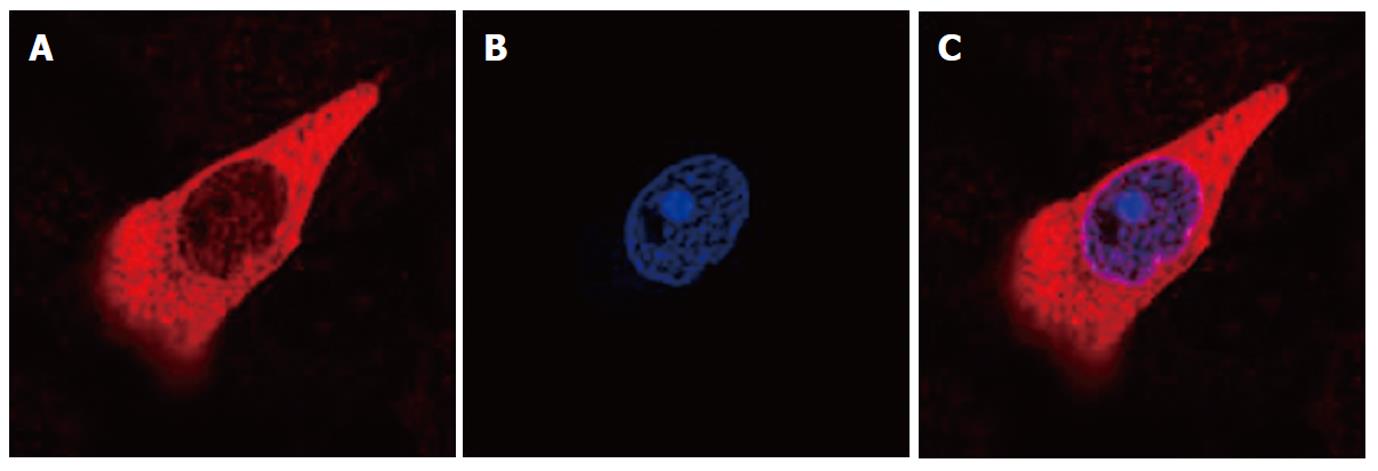
Figure 3 High-mobility group box 1 protein expression in hepatic stellate cell-T6 cells by immunofluorescence staining (original magnification, × 200).
A: High-mobility group box 1 (HMGB1) protein was stained with monoclonal anti-HMGB1 antibody and secondarily by fluoresceinisothiocyanate-conjugated anti-rabbit antibody (red); B: Nuclei were labelled with 4’,6-diamidino-2-phenylindole (blue); C: The merge picture.
Figure 4 Screening the most effective high-mobility group box 1 siRNA sequence.
Total RNA and protein were obtained from hepatic stellate cell-T6 transfected with negative control (NC), mock and three different high-mobility group box 1 (HMGB1) siRNA molecules (shRNAH1, shRNAH2 and shRNAH3). A: Real-time polymerase chain reaction (RT-PCR) for the effect of three different HMGB1 siRNA molecules on HMGB1 mRNA level 48 h after transfection. The expression was normalized against β-actin; B: Semiquantitative analysis of the RT-PCR result; C: Western blotting analyzed HMGB1 protein expression 48 h after transfection; D: Semiquantitative analysis of the western blotting results. Data represent results from one of three similar experiments. Results show that all three HMGB1 shRNA constructs were effective, but shRNAH3 was more efficient in reducing the HMGB1 mRNA and protein levels than shRNAH2 and shRNAH1.
Figure 5 High-mobility group box 1 siRNA inhibited α-smooth muscle actin, collagen typesIand III mRNA expression in hepatic stellate cell-T6 cells.
A: Real-time polymerase chain reaction (RT-PCR) analysis for α-smooth muscle actin (α-SMA), collagen typesIand III mRNA expression in hepatic stellate cell-T6 cells after siRNA high-mobility group box 1 transfection. β-actin was used as the internal loading control; B-D: Semiquantitative analysis of the RT-PCR result. aP < 0.05 vs negative controls (NC) or mock.
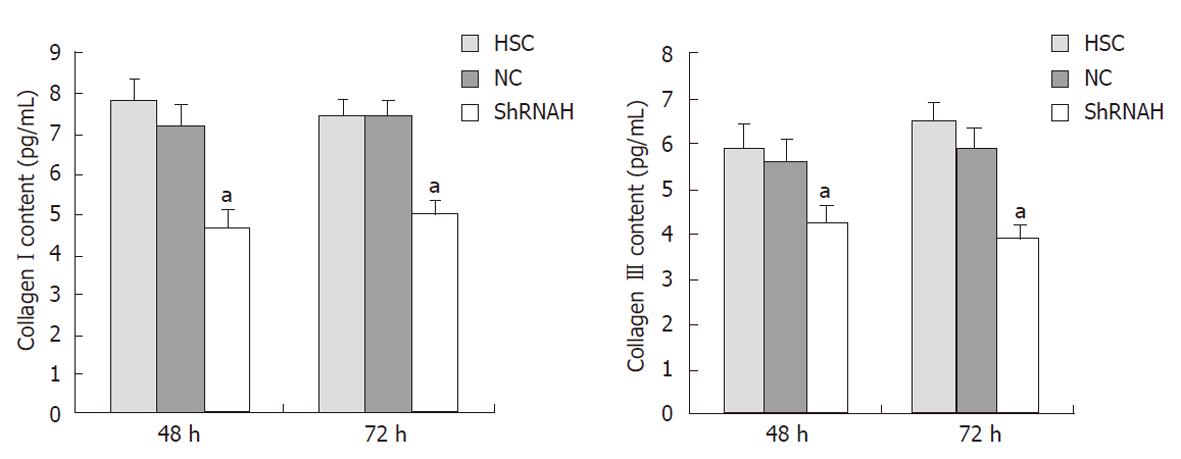
Figure 6 Determination of content of collagen typesIand III after shRNAH3 transfection.
Enzyme-linked immunosorbent assays were used for quantitative determination of collagen typesIand III content hepatic stellate cells (HSCs) culture supernatant at 48 and 72 h after shRNAH3 transfection using Lipofectamine 2000. Values are presented as mean ± SD. aP < 0.05 vs negative controls (NC) and HSC group.
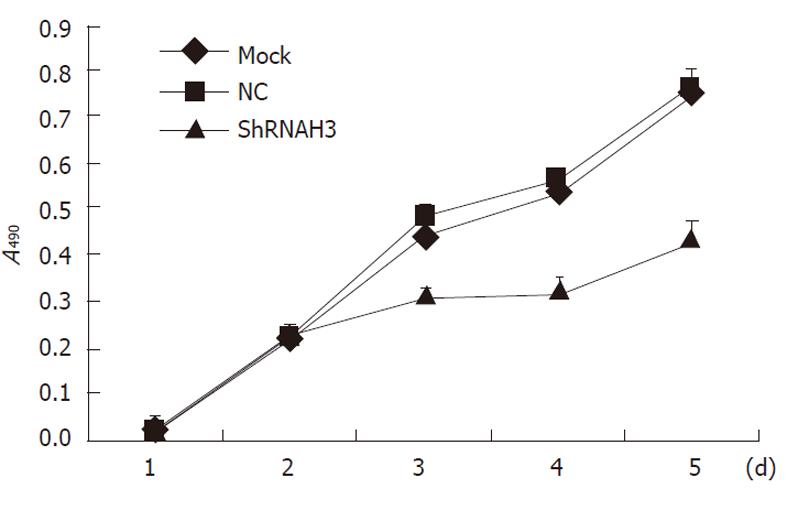
Figure 7 High-mobility group box 1 siRNA suppressed hepatic stellate cell-T6 proliferation.
Cell growth curves of hepatic stellate cell-T6 transfected with shRNAH3 were analyzed by methyl thiazolyl tetrazolium conversion. Each sample was tested in triplicate and error bars were included. Compared with negative controls (NC) group and non-transfection group, proliferation of shRNAH3 group was less at the 3-5 d after transfection (P < 0.05).
- Citation: Ge WS, Wu JX, Fan JG, Wang YJ, Chen YW. Inhibition of high-mobility group box 1 expression by siRNA in rat hepatic stellate cells. World J Gastroenterol 2011; 17(36): 4090-4098
- URL: https://www.wjgnet.com/1007-9327/full/v17/i36/4090.htm
- DOI: https://dx.doi.org/10.3748/wjg.v17.i36.4090


