Copyright
©2011 Baishideng Publishing Group Co.
World J Gastroenterol. Aug 28, 2011; 17(32): 3716-3723
Published online Aug 28, 2011. doi: 10.3748/wjg.v17.i32.3716
Published online Aug 28, 2011. doi: 10.3748/wjg.v17.i32.3716
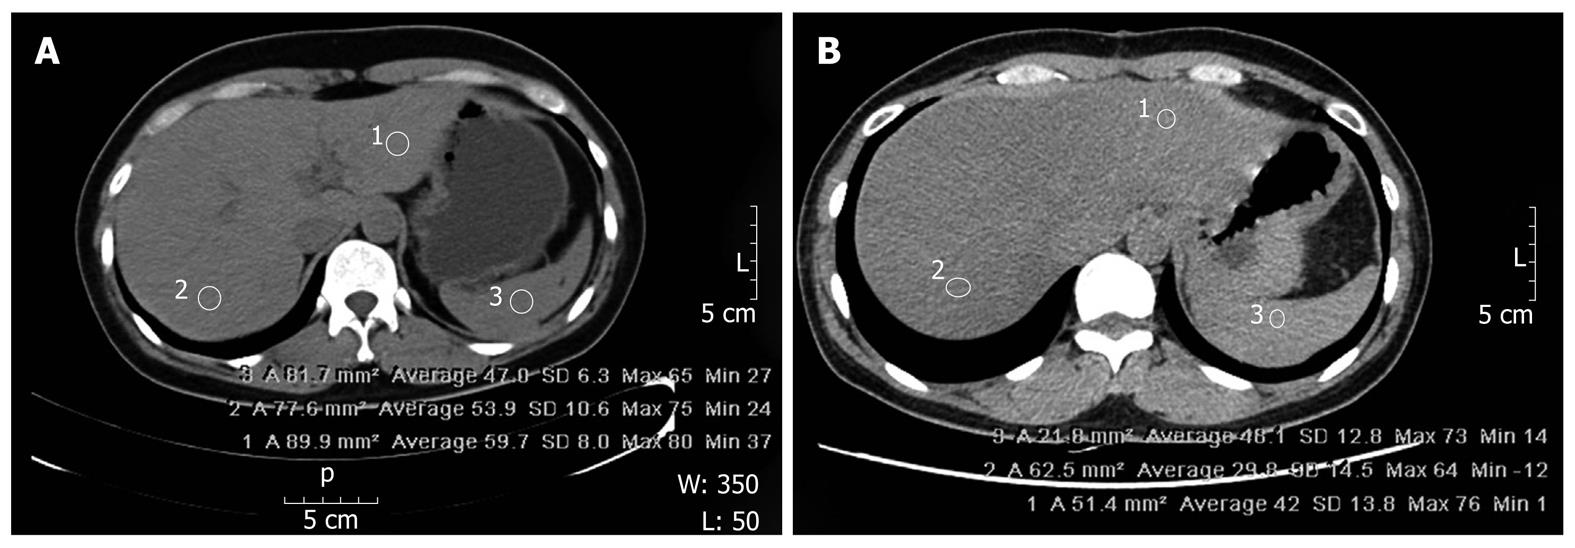
Figure 1 Preoperative and postoperative non-enhanced computed tomography images of a representative patient demonstrating different attenuation values for the spleen and liver.
The inclusion criteria were: (1) CTS-L≥ 10 Housefield unit (HU); or (2) CTL/S≤ 0.9 HU [L: Mean attenuation value for two random points (1, 2) of the liver; S: Attenuation value for one random point (3) of the spleen]. A: Preoperative; B: Postoperative.
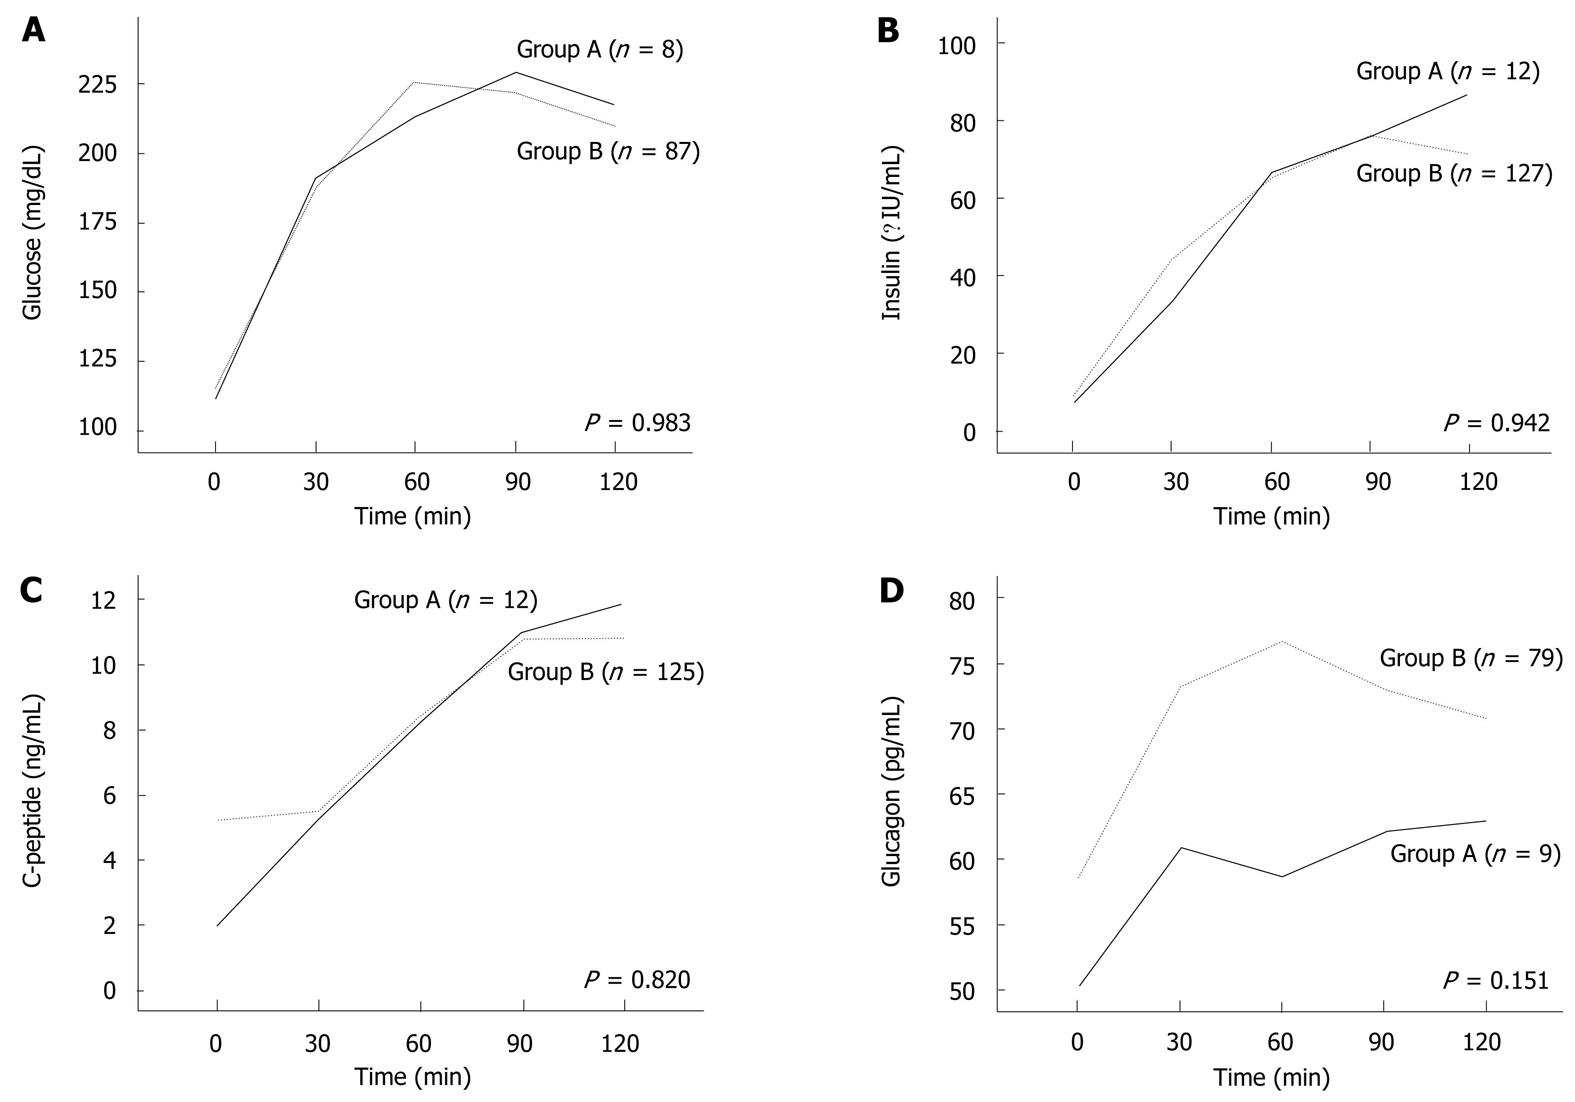
Figure 2 Preoperative oral glucose tolerance test results, continuous stimulation test results for insulin, C-peptide, and glucagon levels.
A: Glucose levels; B: Insulin levels; C: C-peptide levels; D: Glucagon levels.
- Citation: Song SC, Choi SH, Choi DW, Heo JS, Kim WS, Kim MJ. Potential risk factors for nonalcoholic steatohepatitis related to pancreatic secretions following pancreaticoduodenectomy. World J Gastroenterol 2011; 17(32): 3716-3723
- URL: https://www.wjgnet.com/1007-9327/full/v17/i32/3716.htm
- DOI: https://dx.doi.org/10.3748/wjg.v17.i32.3716


