Copyright
©2011 Baishideng Publishing Group Co.
World J Gastroenterol. Apr 21, 2011; 17(15): 2028-2036
Published online Apr 21, 2011. doi: 10.3748/wjg.v17.i15.2028
Published online Apr 21, 2011. doi: 10.3748/wjg.v17.i15.2028
Figure 1 Immunohistochemical expression of 14 markers.
The markers and the cellular location of positive staining are listed below: A: P53: nuclear; B: APC: cytoplasm; C: P21ras: cytoplasm; D: E-cadherin: membrane or cytoplasm; E: Endothelin B receptor: cytoplasm; F: Shp2: cytoplasm; G: ADCY-2: cytoplasm; H: SPARCL1: cytoplasm; I: neuroligin1: nuclear or cytoplasm; J: hsp27: nuclear or cytoplasm; K: MMP9: cytoplasm; L: MAPK: cytoplasm; M: MSH2: nuclear; N: Rho: cytoplasm. (Scale bar = 100 μm)
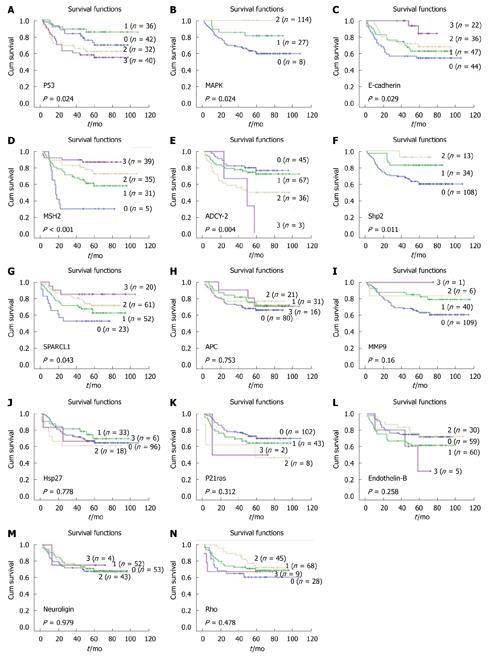
Figure 2 Kaplan-Meier curves of 14 markers.
A: P53; B: MAPK; C: E-cadherin; D: MSH2; E: ADCY-2; F: Shp2; G: SPARCL1; H: APC; I: MMP9; J: Hsp27; K: P21ras; L: endothelin-B receptor; M: Neuroligin1; N: Rho.
Figure 3 Prognostic value of p53/SPARCL1 model in colorectal cancer patients.
According to the prediction result (PR) given by the p53/SPARCL1 model, patients could be divided into two groups: “high risk” (PR > 0) and “low risk” (PR < 0). A: 3-year survival of the “low risk” group was 88.30%, significantly higher at twice that of the “high risk” group, which was only 37.84% (P < 0.001). B: The 3-year survival of stage II (n = 43) and III (n = 56) patients was 88.40% vs 62.50% (P = 0.039), with an only 15.90% survival difference (P = 0.039); C: The same 99 stage II/III patients, when divided by the PR of the p53/SPARCL1 model: the 3-year survival of “low risk” (n = 70) and “high risk” (n = 29) group was 87.14% vs 37.93%, with a survival difference of 49.21% (P < 0.001), much more than the difference between stage II and III patients; D: According to the PR of the p53/SPARCL1 model, the 3-year survival of “low risk” and “high risk” patients at stage II was 100% and 54.55%, respectively, with a significant difference of 45.45% (P < 0.001); E: At stage III (n = 56), the 3-year survival was 78.95% of “low risk” patients and 27.78% of “high risk” patients, with a 51.17% higher survival rate (P < 0.001); F: At stage III (n = 56), the 3-year survival was different between stage IIIA/IIIB (n = 34) and IIIC (n = 22) patients: 82.36% vs 31.82% (P < 0.001).
- Citation: Yu SJ, Yu JK, Ge WT, Hu HG, Yuan Y, Zheng S. SPARCL1, Shp2, MSH2, E-cadherin, p53, ADCY-2 and MAPK are prognosis-related in colorectal cancer. World J Gastroenterol 2011; 17(15): 2028-2036
- URL: https://www.wjgnet.com/1007-9327/full/v17/i15/2028.htm
- DOI: https://dx.doi.org/10.3748/wjg.v17.i15.2028


