Copyright
©2011 Baishideng Publishing Group Co.
World J Gastroenterol. Mar 14, 2011; 17(10): 1326-1331
Published online Mar 14, 2011. doi: 10.3748/wjg.v17.i10.1326
Published online Mar 14, 2011. doi: 10.3748/wjg.v17.i10.1326
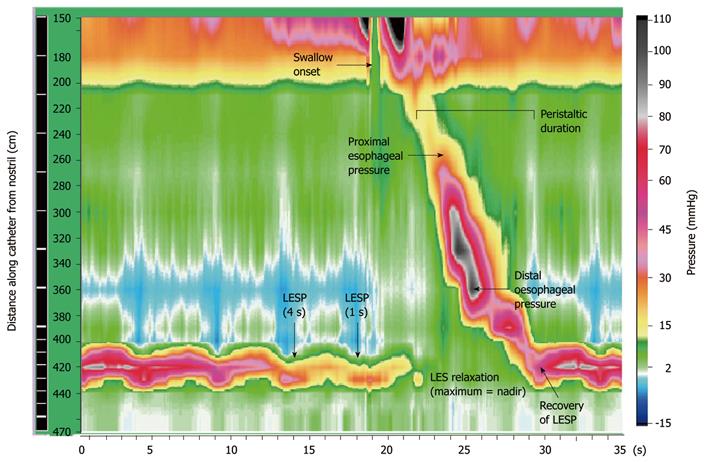
Figure 1 Example of swallow pressure topography spanning from the pharynx (15-20 cm) to stomach (44-47 cm), in a young patient with normal peristalsis and lower esophageal sphincter relaxation.
Pressure data (amplitudes shown by colour gradient) are displayed with time on the x-axis and location of sensors on the y-axis. Points of measurement for motility parameters are indicated with arrows. Pressure sensors located in the region of the lower esophageal sphincter (LES) are spaced 1 cm apart, spanning a 6 cm segment. LESP: Lower esophageal sphincter pressure.
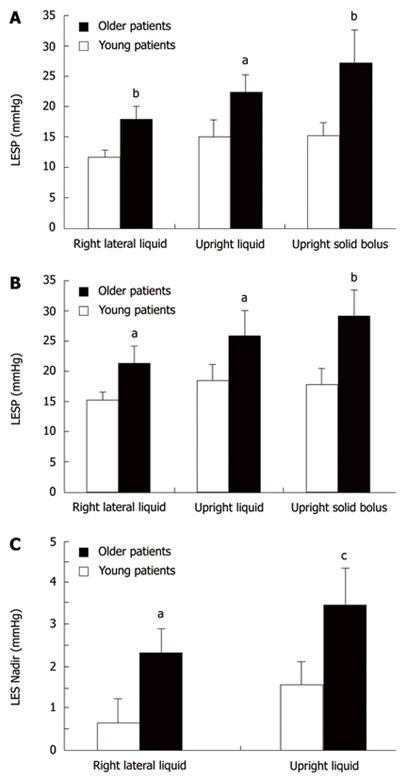
Figure 2 Lower esophageal sphincter pressure at 1 s (A) and 4 s (B) prior to swallow, and lower esophageal sphincter nadir pressure (C), in right lateral and upright postures with liquids and solids, in young (n = 19; 32 ± 1.
7 years) and older (n = 19; 85 ± 0.7 year) patients with dysphagia. aP < 0.05; bP < 0.01; cP = 0.01 vs young. LES: Lower esophageal sphincter; LESP: Lower esophageal sphincter pressure.
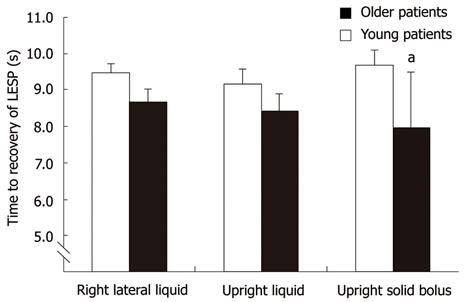
Figure 3 Time to recovery of lower esophageal sphincter tone after relaxation in right lateral and upright postures and with solids, in young and older patients with dysphagia.
aP = 0.05 vs young. LESP: Lower esophageal sphincter pressure.
- Citation: Besanko LK, Burgstad CM, Mountifield R, Andrews JM, Heddle R, Checklin H, Fraser RJ. Lower esophageal sphincter relaxation is impaired in older patients with dysphagia. World J Gastroenterol 2011; 17(10): 1326-1331
- URL: https://www.wjgnet.com/1007-9327/full/v17/i10/1326.htm
- DOI: https://dx.doi.org/10.3748/wjg.v17.i10.1326


