Copyright
©2010 Baishideng Publishing Group Co.
World J Gastroenterol. Dec 14, 2010; 16(46): 5881-5888
Published online Dec 14, 2010. doi: 10.3748/wjg.v16.i46.5881
Published online Dec 14, 2010. doi: 10.3748/wjg.v16.i46.5881
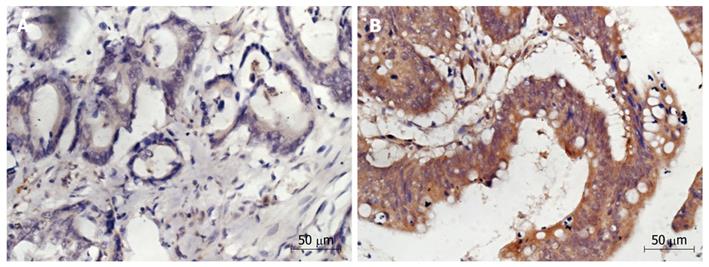
Figure 1 Immunohistochemistry showing phosphatase and tensin protein expression.
A: Patients with absent phosphatase and tensin (PTEN) expression (HE stain, × 400); B: Patients showing positive PTEN expression (HE stain, × 400).
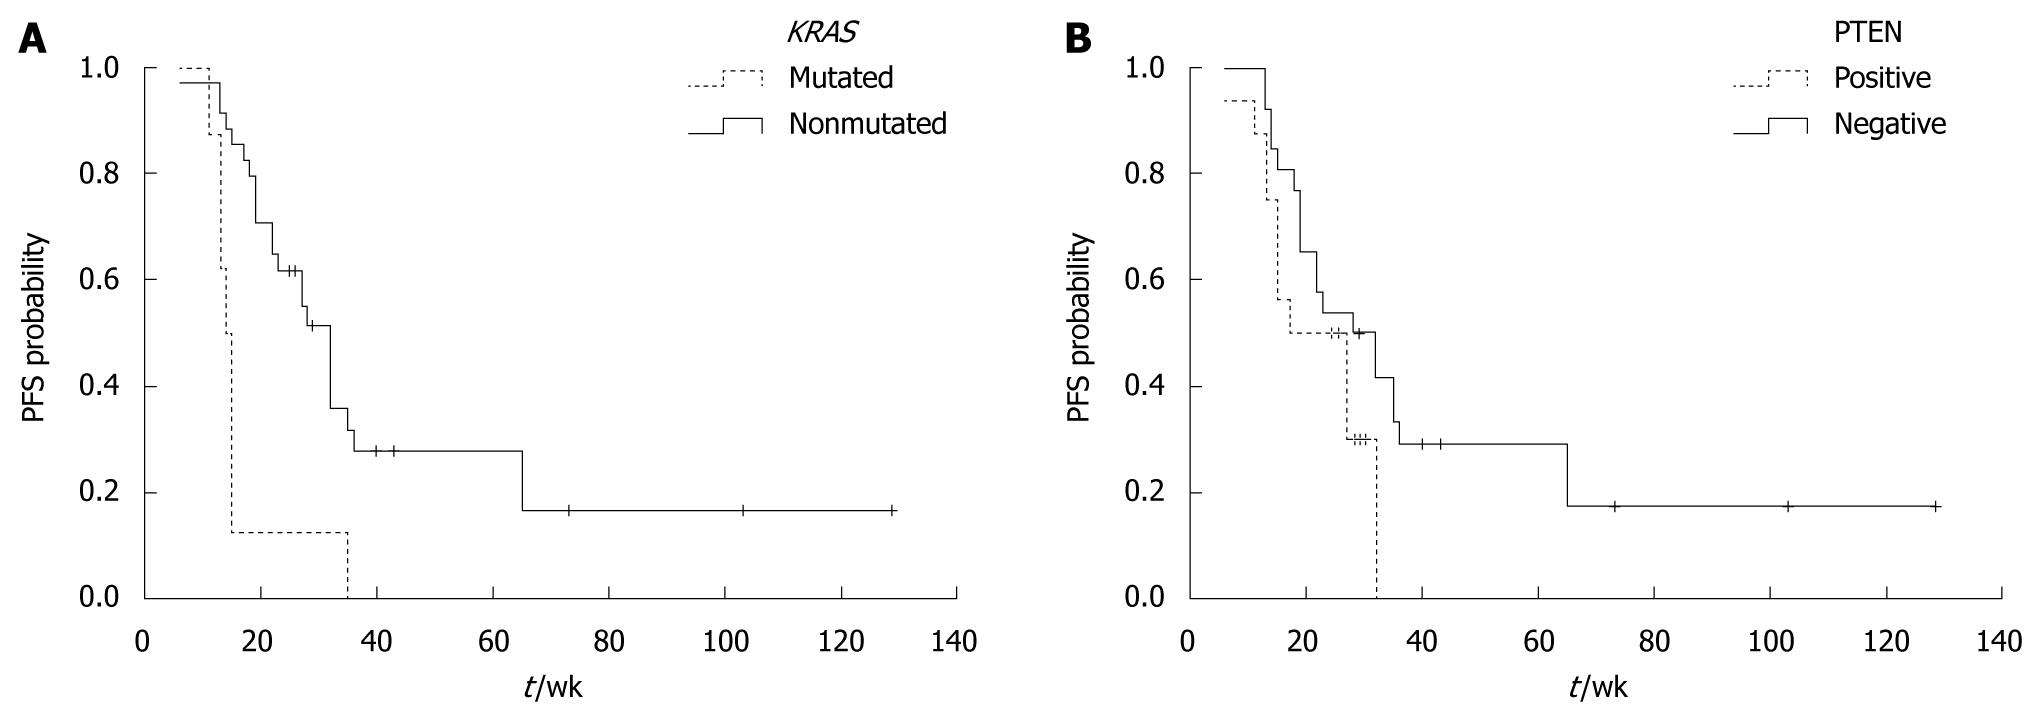
Figure 2 Progression-free survival time of patients with or without KRAS mutation (A) and phosphatase and tensin protein expression (B).
A: P < 0.001; B: P = 0.07. PFS: Progression-free survival.
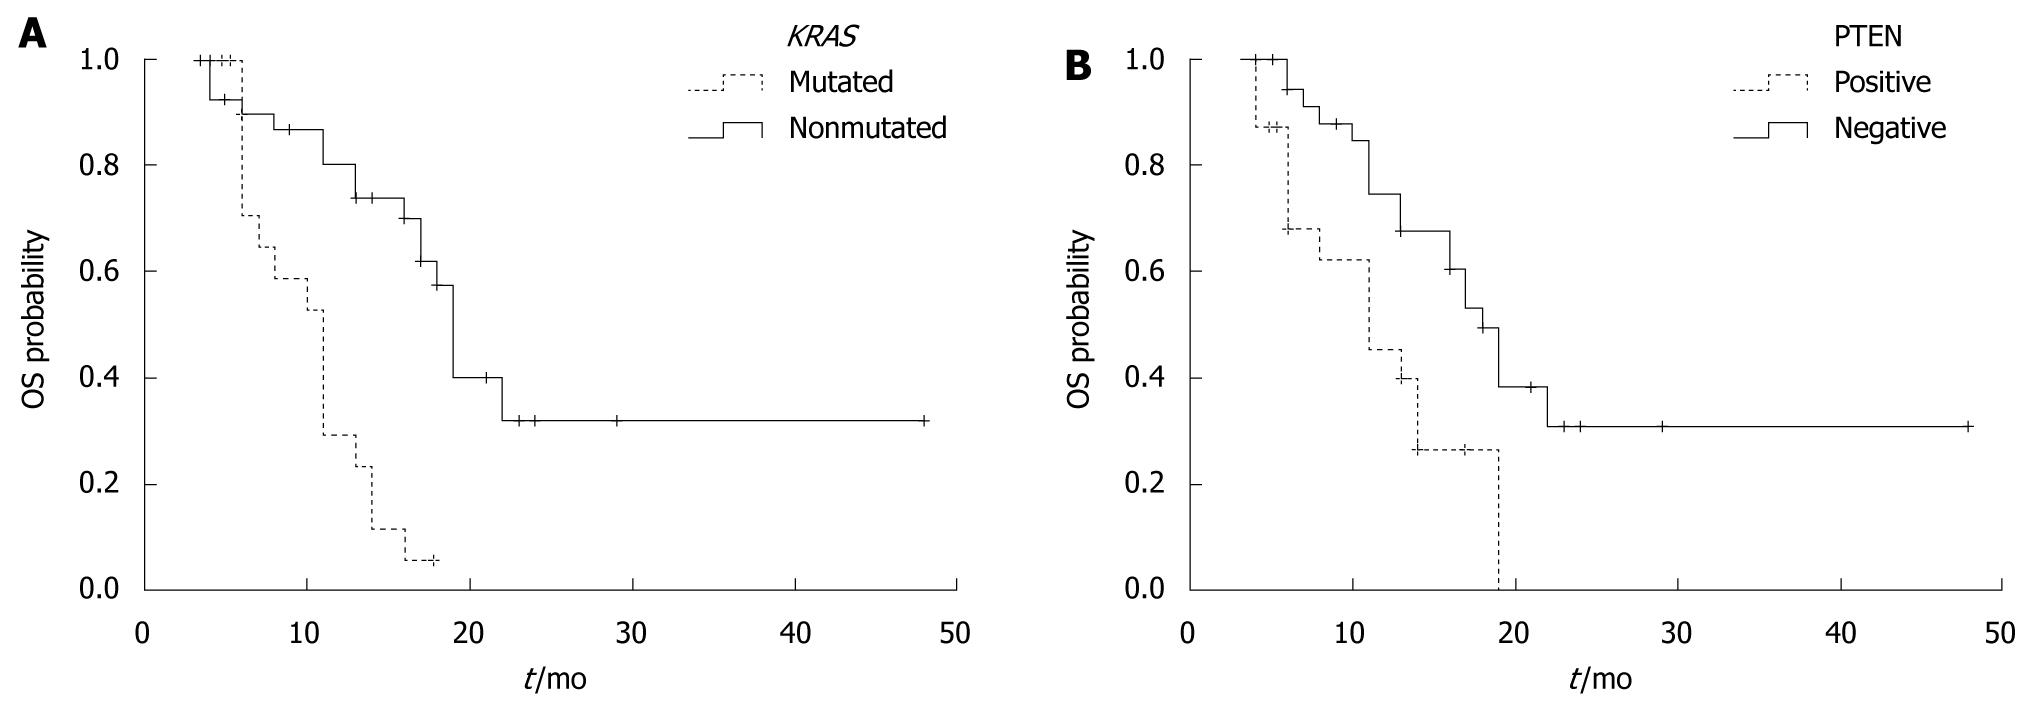
Figure 3 Overall survival time of patients with or without KRAS mutation (A) and phosphatase and tensin protein expression and skin toxicity (B).
A: P < 0.001; B: P = 0.004. OS: Overall survival.
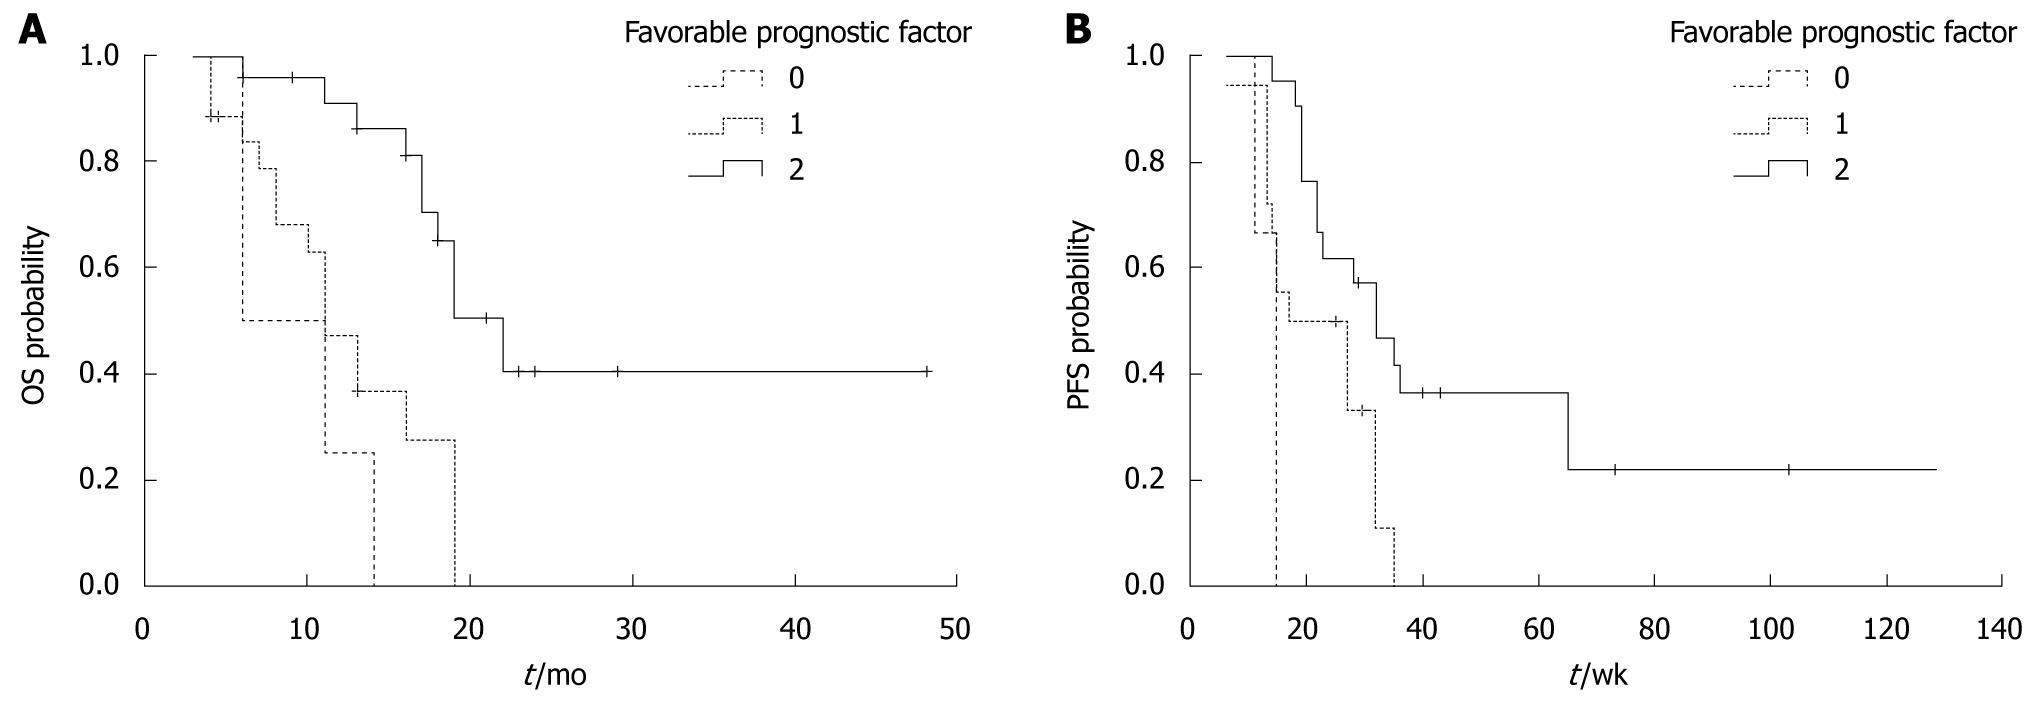
Figure 4 Overall survival and progression-free survival time of patients with or without favorable prognostic factors.
A: P < 0.001; B: P = 0.001. 0: KRAS mutation and loss of phosphatase and tensin (PTEN); 1: Either no KRAS mutation or normal PTEN expression; 2: No KRAS mutation and normal PTEN expression. OS: Overall survival; PFS: Progression-free survival.
-
Citation: Li FH, Shen L, Li ZH, Luo HY, Qiu MZ, Zhang HZ, Li YH, Xu RH. Impact of
KRAS mutation and PTEN expression on cetuximab-treated colorectal cancer. World J Gastroenterol 2010; 16(46): 5881-5888 - URL: https://www.wjgnet.com/1007-9327/full/v16/i46/5881.htm
- DOI: https://dx.doi.org/10.3748/wjg.v16.i46.5881


