Copyright
©2010 Baishideng.
World J Gastroenterol. May 21, 2010; 16(19): 2362-2370
Published online May 21, 2010. doi: 10.3748/wjg.v16.i19.2362
Published online May 21, 2010. doi: 10.3748/wjg.v16.i19.2362
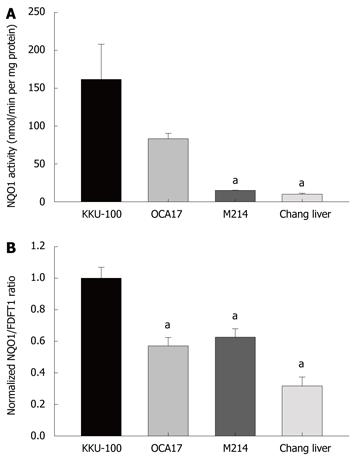
Figure 1 NQO1 activity and mRNA expression of cultured cells.
A: NQO1 activity: Cholangiocarcinoma cells, KKU-100, KKU-OCA17, KKU-M214, and Chang liver cells were cultured in 96-well plates for assay of NQO1 activity by enzymatic methods; B: Expression of NQO1 mRNA: The cells were cultured in 6-well plates. Total RNA was extracted by Trizol reagent, converted to cDNA and analyzed by real-time PCR using FDFT1 as internal control. Bars represent mean ± SE, each from 3 experiments. aP < 0.05 vs control group.
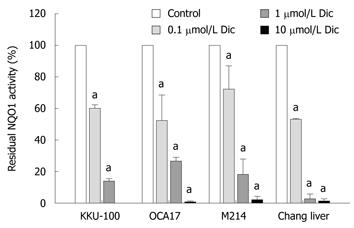
Figure 2 Concentration response of NQO1 inhibition by dicoumarol.
KKU-100, KKU-OCA17, KKU-M214, and Chang liver cells were cultured in 96-well plates overnight. The NQO1 activity was assayed in the presence of the inhibitor dicoumarol at concentrations from 0.1-10 μmol/L. Bars represent mean ± SE, each from 3 experiments. aP < 0.05 vs control group.
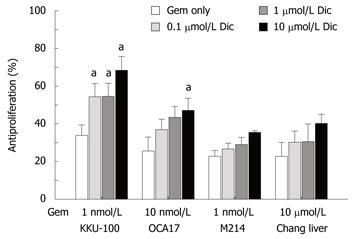
Figure 3 Potentiation of cytotoxicity of gemcitabine by dicoumarol.
KKU-100, KKU-OCA17, KKU-M214, and Chang liver cells were cultured in 96-well plates overnight. Cultured cells were pretreated with dicoumarol (0.1-10 μmol/L) for 4 h before treatment with gemcitabine at 1 nmol/L, 10 nmol/L, 1 nmol/L and 10 μmol/L, for KKU-100, KKU-OCA17, KKU-M214, and Chang liver cells, respectively. Antiproliferation was analyzed by staining the cells with fluorescent dyes before examination under fluorescent microscope. Bars represent mean ± SE, each from 3 experiments. aP < 0.05 vs control group.
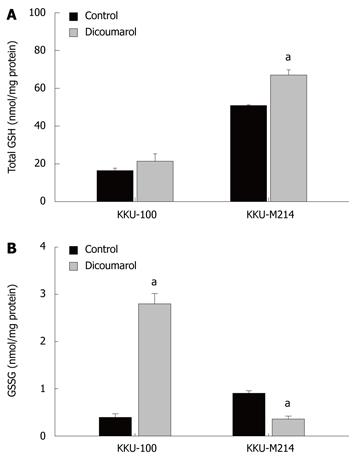
Figure 4 Glutathione redox status in cells treated with dicoumarol.
KKU-100 and KKU-M214 cells were cultured and treated with dicoumarol (10 μmol/L) for 4 h, and cells were scraped for assays of (A) total glutathione and (B) glutathione disulfide. Bars represent mean ± SE, each from 3 experiments. aP < 0.05 vs control group.
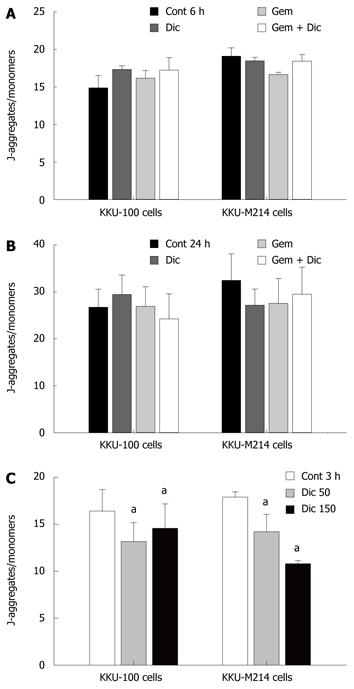
Figure 5 Assay of mitochondrial transmembrane potential and reactive oxygen in CCA cells.
The mitochondrial transmembrane potential was analyzed by using JC-1 fluorescent probe. Fluorescent readings of the J-aggregates and J monomers were used as measurement of mitochondrial transmembrane potential. KKU-100 and KKU-M214 cells were cultured in 96-well black plates. The cultured cells were pretreated with dicoumarol at 10 μmol/L for 4 h, then gemcitabine at 1 nmol/L was added and incubated at various times. A: Incubation for 6 h; B: Incubation for 24 h; C: Other cultured cells were treated with dicoumarol at 50 and 150 μmol/L for 3 h. Bars represent mean ± SE, each from triplicate assay. aP < 0.05 vs control group.
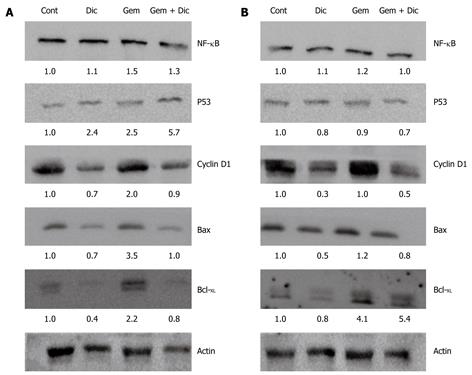
Figure 6 Western blotting analysis of proteins related to survival.
KKU-100 and KKU-M214 cells were cultured overnight, pretreated with 10 μmol/L dicoumarol for 4 h before being treated with 1 nmol/L gemcitabine for 24 h. Cultured cells were collected for Western blotting analysis using β-actin as an internal control for equal protein loading. A: KKU-100 cells; B: KKU-M214 cells. Cont: Controls; Dic: Dicoumarol alone; Gem: Gemcitabine alone; Gem + Dic: Combination of gemcitabine and dicoumarol. Values were an average from two experiments of the target protein normalized with the internal control.
- Citation: Buranrat B, Prawan A, Kukongviriyapan U, Kongpetch S, Kukongviriyapan V. Dicoumarol enhances gemcitabine-induced cytotoxicity in high NQO1-expressing cholangiocarcinoma cells. World J Gastroenterol 2010; 16(19): 2362-2370
- URL: https://www.wjgnet.com/1007-9327/full/v16/i19/2362.htm
- DOI: https://dx.doi.org/10.3748/wjg.v16.i19.2362


