Copyright
©2009 The WJG Press and Baishideng.
World J Gastroenterol. Dec 7, 2009; 15(45): 5732-5739
Published online Dec 7, 2009. doi: 10.3748/wjg.15.5732
Published online Dec 7, 2009. doi: 10.3748/wjg.15.5732
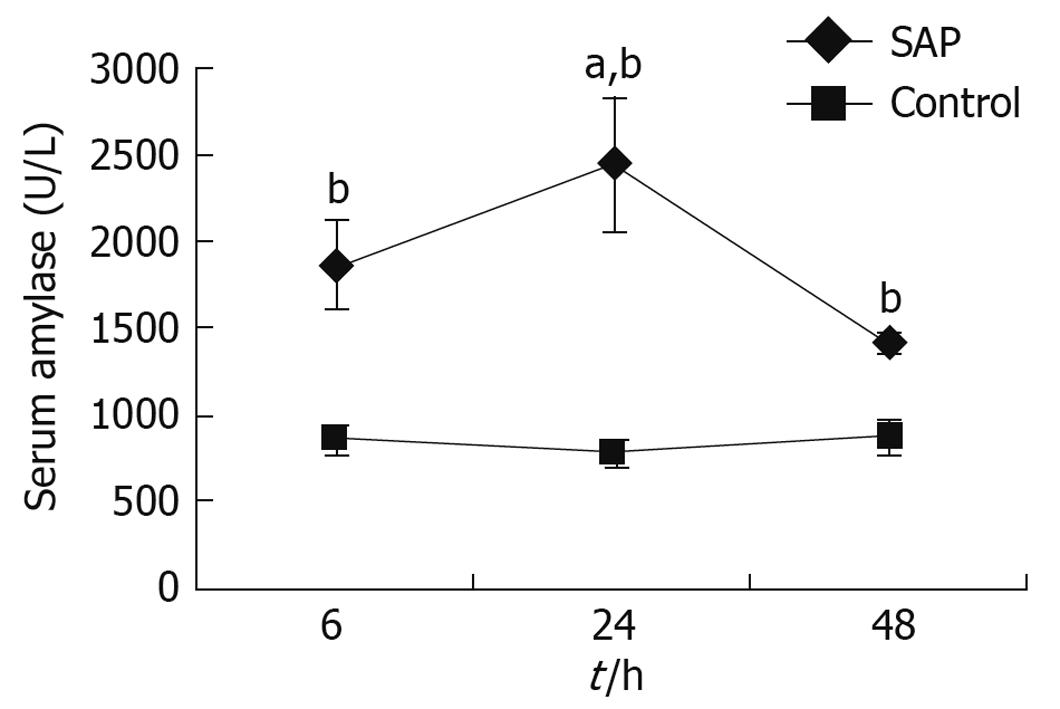
Figure 1 Amylase level in serum.
Compared with control animals, serum amylase levels in severe acute pancreatitis (SAP) rats were higher at each time point (6, 24 and 48 h), bP < 0.01. At 24 h, the amylase level of the pancreatitis model reached a peak, and was higher than the other 2 time points, aP < 0.05.
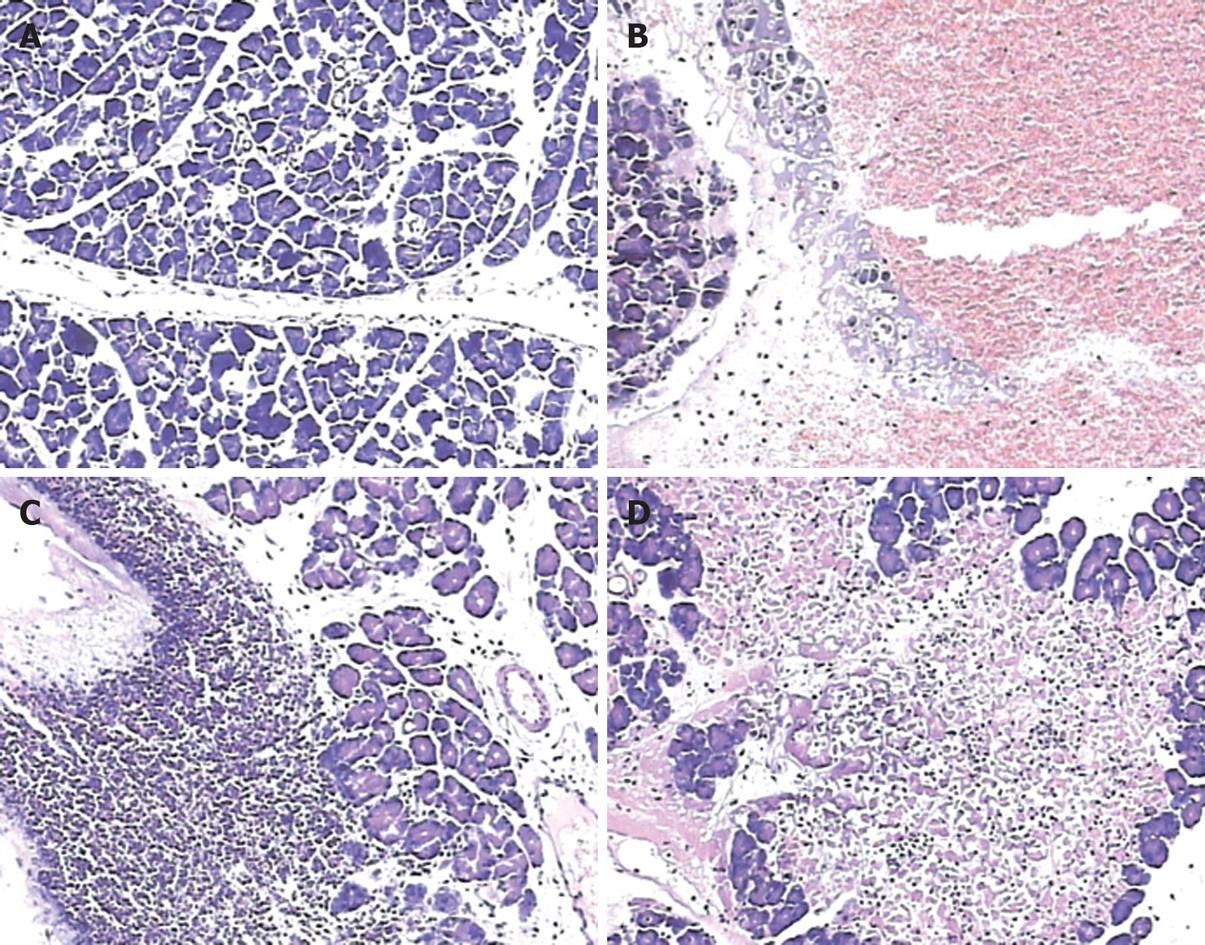
Figure 2 Pancreatic pathology (HE, × 100).
A: Normal pancreatic histology; B: Pancreatic damage induced 6 h after pancreatitis induction. Typical pathological features were edema and hemorrhage; C: Apparent leukocyte infiltration was observed 24 h after surgery; D: Pancreatic pathology induced 48 h after surgery, showing a confluent area of acinar cell necrosis.
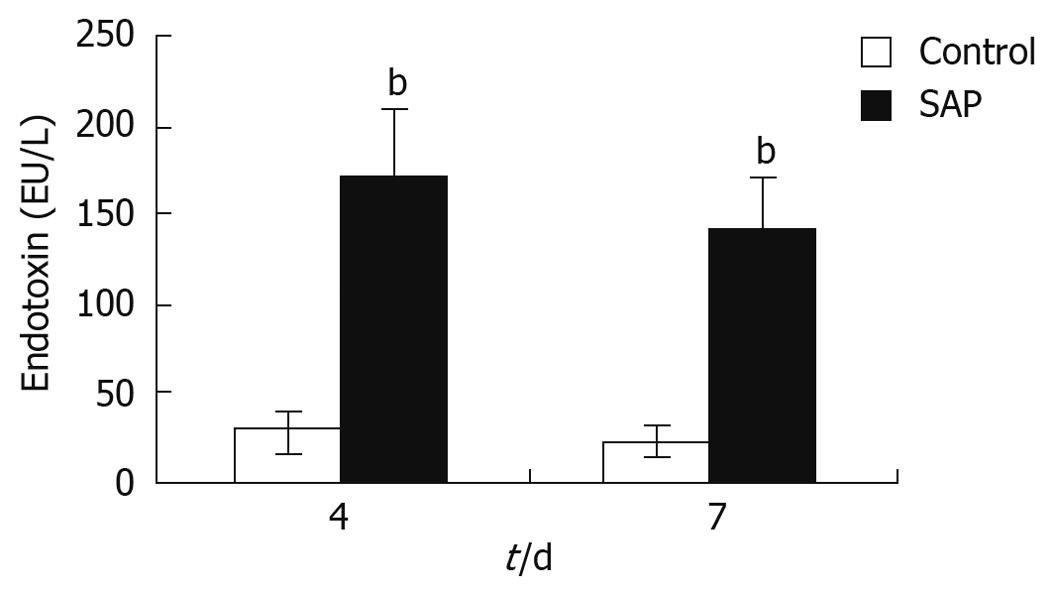
Figure 3 Endotoxin level in serum.
On the 4th and 7th days, the serum endotoxin level was markedly higher in the pancreatitis group compared to the control group, bP < 0.01.
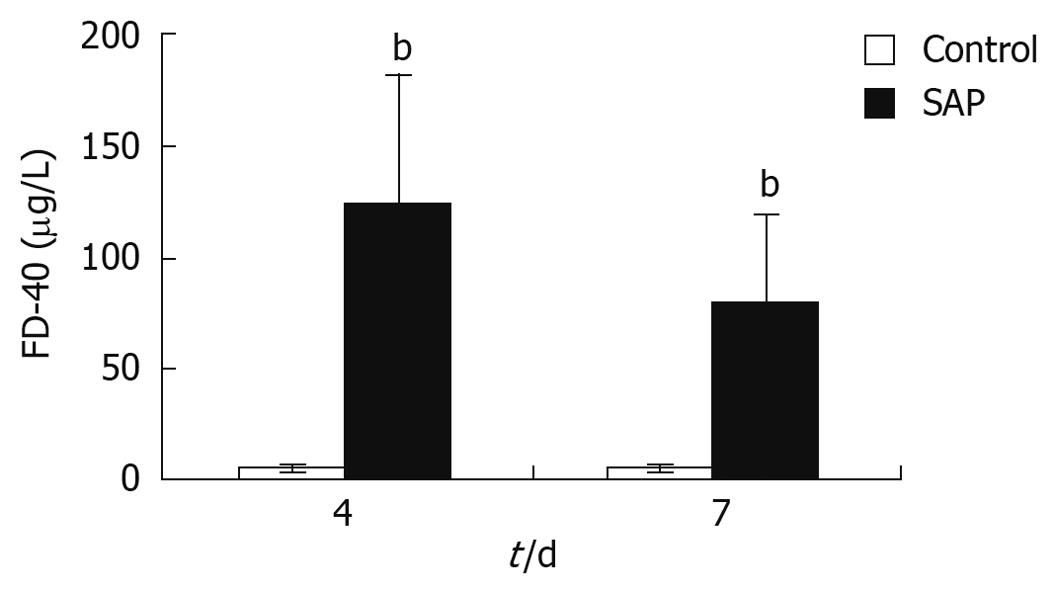
Figure 4 FITC-Dextran (FD-40) levels of serum in the superior mesenteric vein (SMV).
The serum level of FD-40 in SMV was significantly higher in the pancreatitis group than in the control group on the 4th and 7th days, bP < 0.01, though the level had decreased almost a half between days 4 and 7.
Figure 5 Distal iliac mucosa electron microscopy.
A: Changes of microvilli in a SAP rat, showing loose, shortened microvilli, with some points lost (arrows) (Original magnification, × 28.5 K); B: Changes of the intermediate junction in a SAP rat, which was unclear with breakage in some parts (arrows) (× 15.5 K); C (× 28.5 K) and D (× 21.0 K) are representative electron microscopy images of the iliac mucosa in control rats, showing long, tight microvilli (arrow) and intact intermediate junctions (arrows).
- Citation: Liu ZH, Peng JS, Li CJ, Yang ZL, Xiang J, Song H, Wu XB, Chen JR, Diao DC. A simple taurocholate-induced model of severe acute pancreatitis in rats. World J Gastroenterol 2009; 15(45): 5732-5739
- URL: https://www.wjgnet.com/1007-9327/full/v15/i45/5732.htm
- DOI: https://dx.doi.org/10.3748/wjg.15.5732


