Copyright
©2009 The WJG Press and Baishideng.
World J Gastroenterol. Nov 21, 2009; 15(43): 5455-5460
Published online Nov 21, 2009. doi: 10.3748/wjg.15.5455
Published online Nov 21, 2009. doi: 10.3748/wjg.15.5455
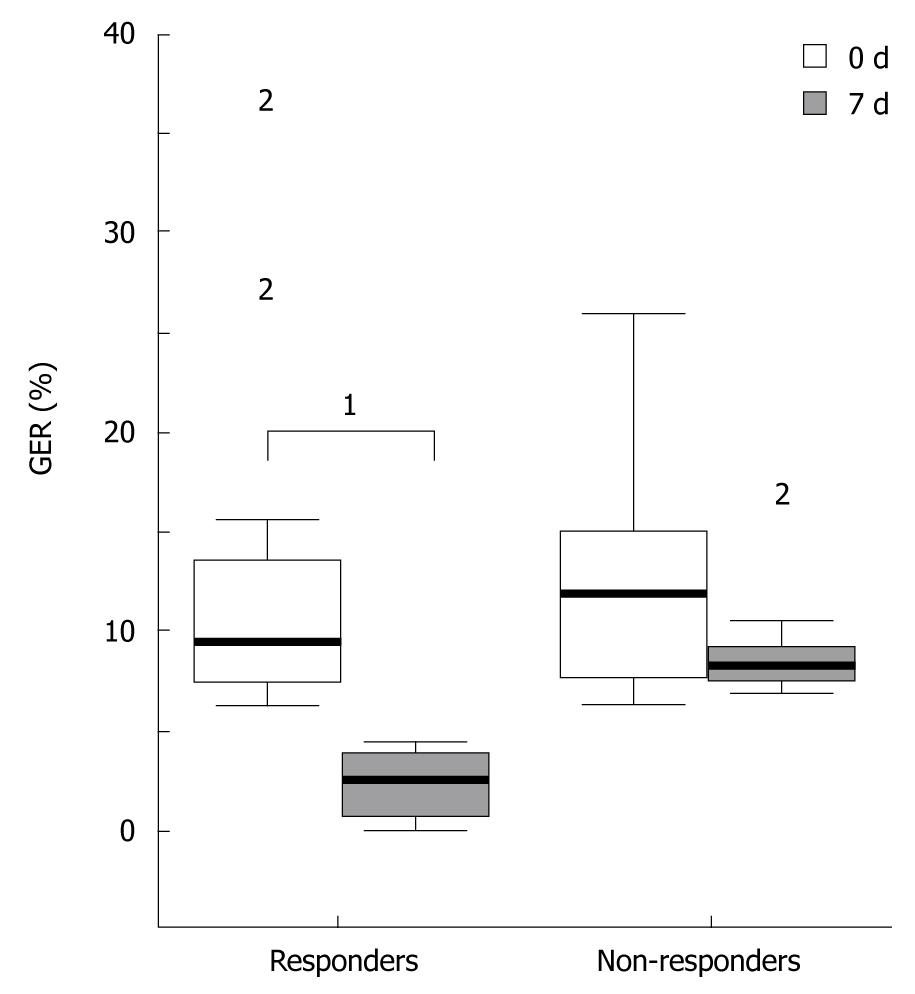
Figure 1 The median (interquartiles) variation in GER-% using two successive pH-metry readings performed in the responders (RESP) and non-responders (N-RESP) to PEG patients.
1Denotes statistical significance; 2Denotes outlier cases.
- Citation: Douzinas EE, Andrianakis I, Livaditi O, Bakos D, Flevari K, Goutas N, Vlachodimitropoulos D, Tasoulis MK, Betrosian AP. Reasons of PEG failure to eliminate gastroesophageal reflux in mechanically ventilated patients. World J Gastroenterol 2009; 15(43): 5455-5460
- URL: https://www.wjgnet.com/1007-9327/full/v15/i43/5455.htm
- DOI: https://dx.doi.org/10.3748/wjg.15.5455


