Copyright
©2008 The WJG Press and Baishideng.
World J Gastroenterol. Jul 14, 2008; 14(26): 4156-4167
Published online Jul 14, 2008. doi: 10.3748/wjg.14.4156
Published online Jul 14, 2008. doi: 10.3748/wjg.14.4156
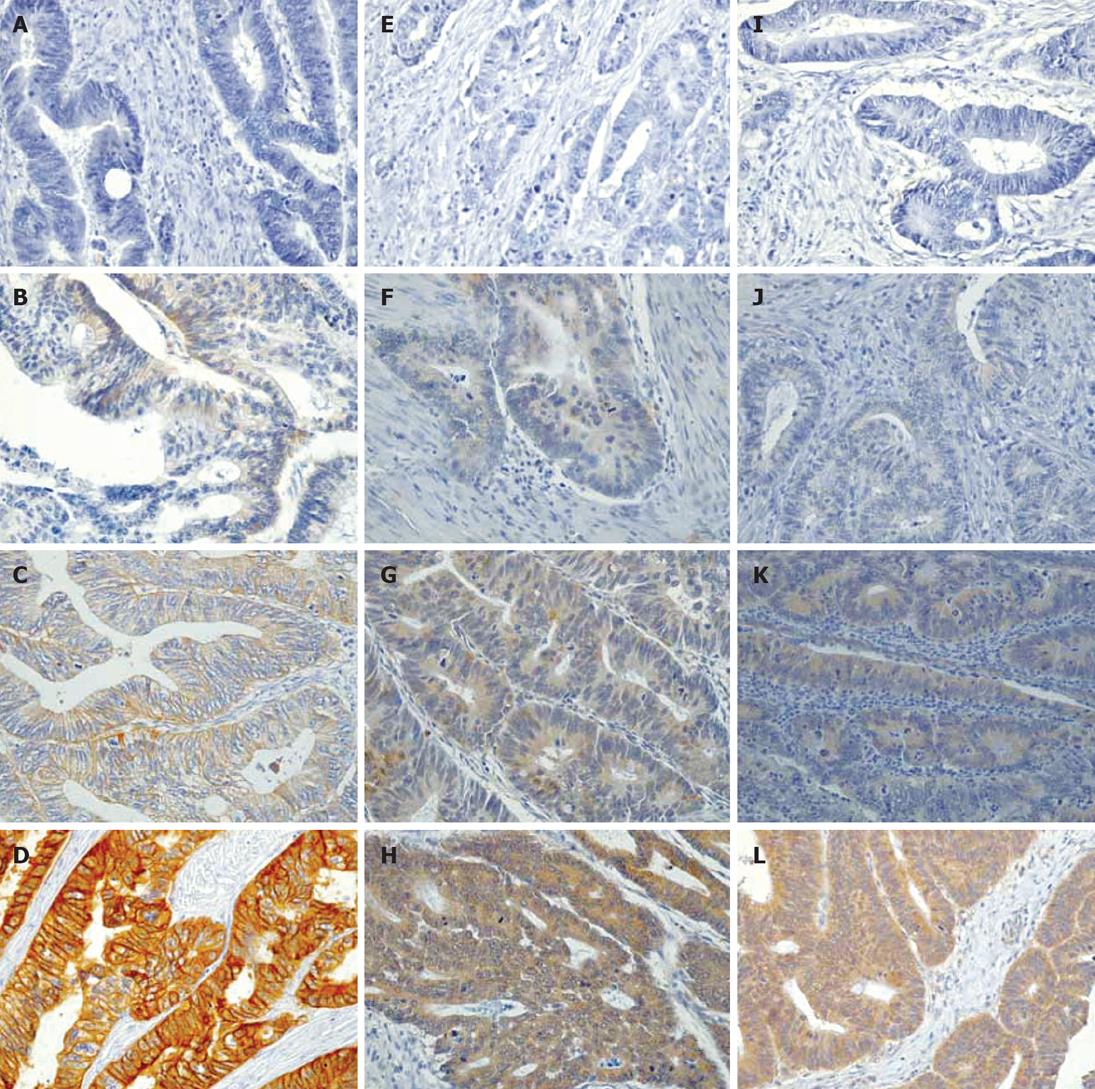
Figure 1 Immunohistochemical analysis of the expression levels of EGFR (A-D), VEGF-C (E-H) and VEGF-D (I-L) in human colorectal cancer sections (× 400).
A, E and I: No expression; B, F and J: Weak expression; C, G and K: Moderate expression; D, H and L: Strong expression.
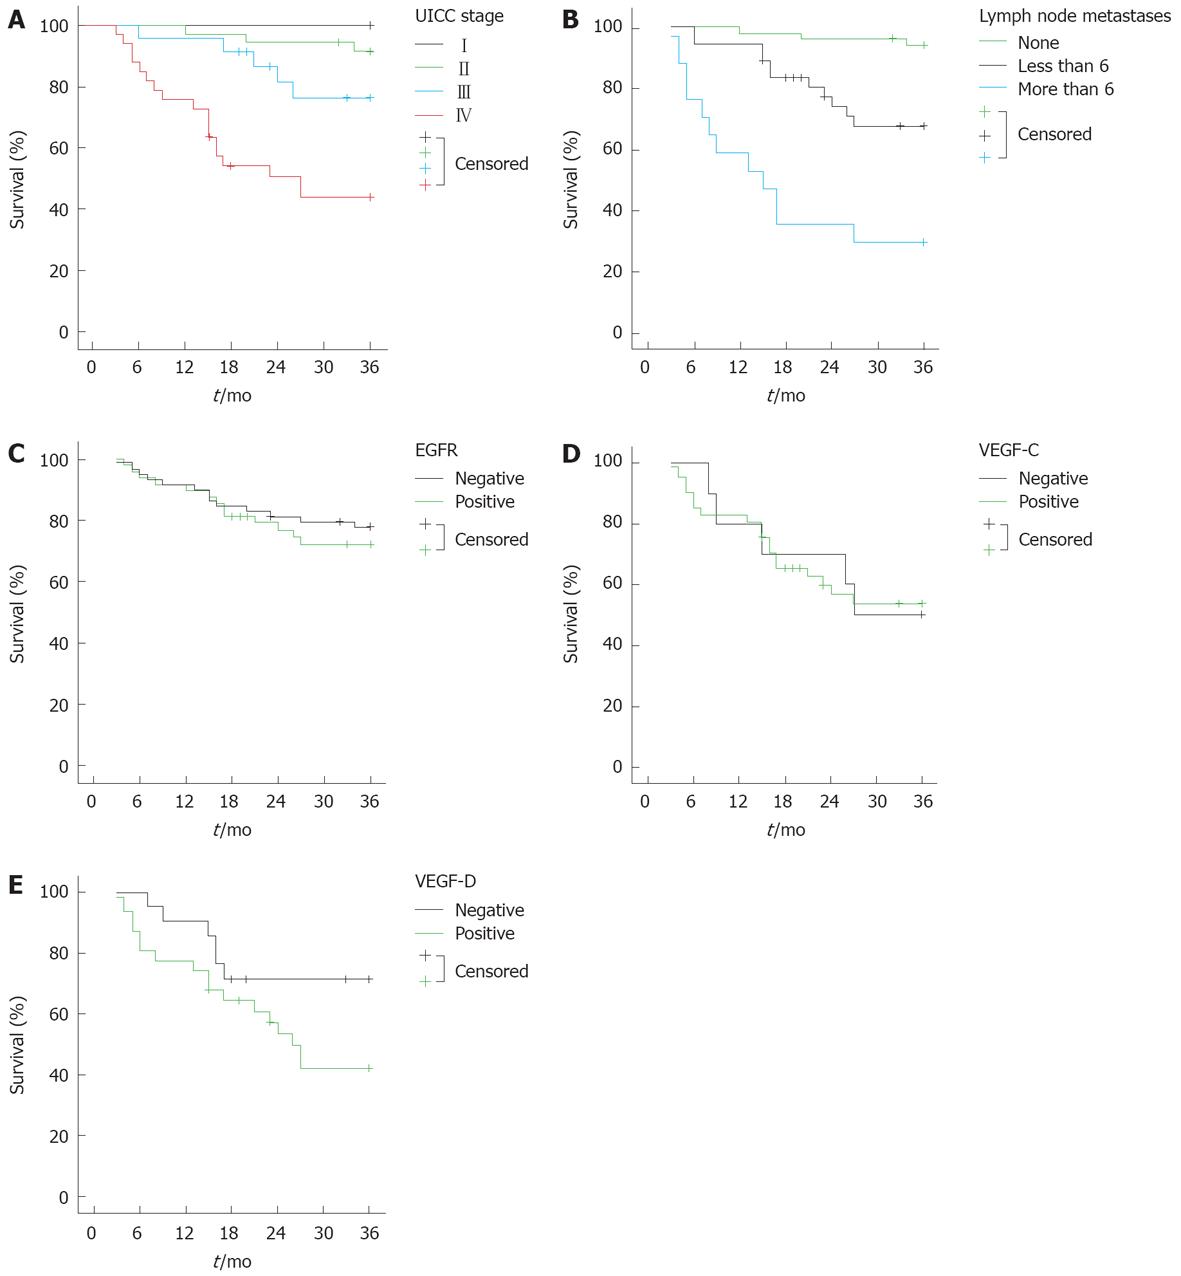
Figure 2 Kaplan Meier survival analyses of colorectal cancer subgroups in relation to baseline disease characteristics and EGFR, VEGF-C or VEGF-D expression.
A-C: Survival analysis for all patients in relation to UICC stage (P < 0.001), the number of metastases (P < 0.001) and EGFR staining (P = 0.546), respectively; D and E: The 3 years survival in patients with lymph node metastasis in relation, respectively, to the expression of VEGF-C (P = 0.967) and VEGF-D (P = 0.067).
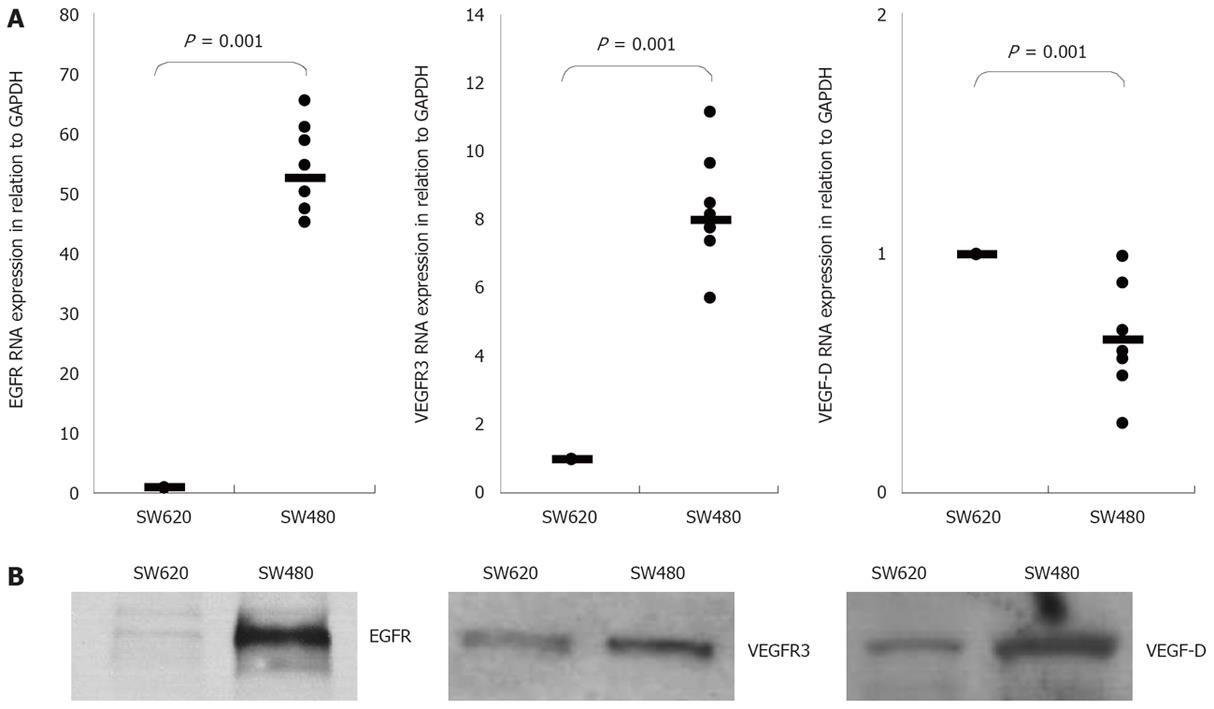
Figure 3 Quantitative EGFR, VEGFR3 and VEGF-D mRNA expression (A) and Western blot analysis (B) of untreated SW480 and SW620.
The α-tubulin signal served as a control to confirm the loading of equivalent amounts of protein per track.
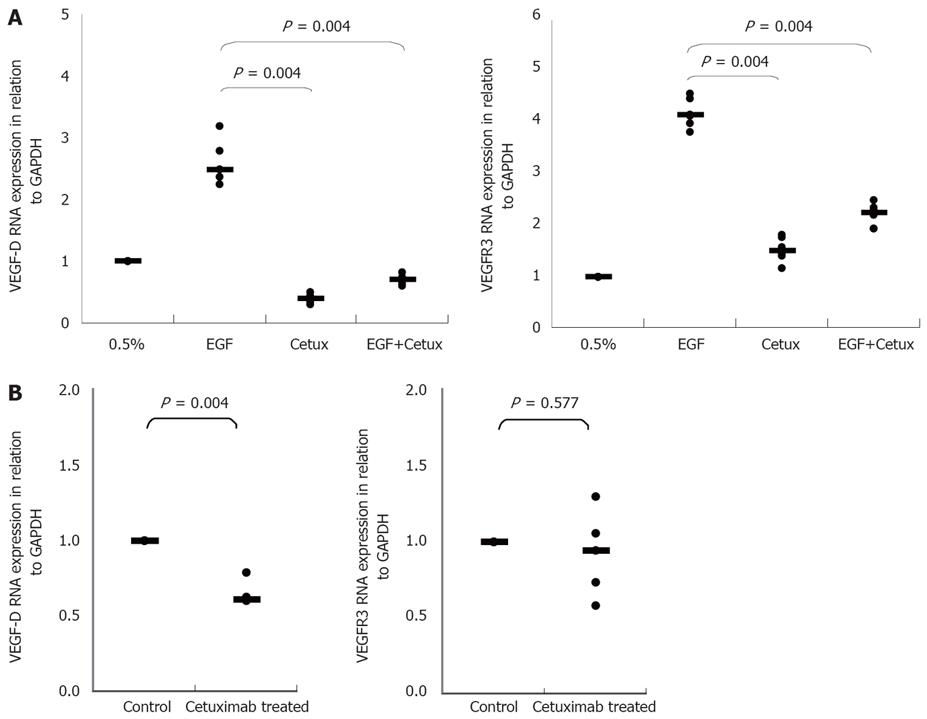
Figure 4 Effect of cetuximab on (A) the expression of VEGF-D and VEGFR3 in SW480 cells cultured in the presence and absence of EGF and (B) the in vivo levels of VEGF-D and VEGFR3 in a NOD/SCID mouse xenograft model.
- Citation: Moehler M, Frings C, Mueller A, Gockel I, Schimanski CC, Biesterfeld S, Galle PR, Holtmann MH. VEGF-D expression correlates with colorectal cancer aggressiveness and is downregulated by cetuximab. World J Gastroenterol 2008; 14(26): 4156-4167
- URL: https://www.wjgnet.com/1007-9327/full/v14/i26/4156.htm
- DOI: https://dx.doi.org/10.3748/wjg.14.4156


