Copyright
©2007 Baishideng Publishing Group Co.
World J Gastroenterol. Nov 28, 2007; 13(44): 5944-5950
Published online Nov 28, 2007. doi: 10.3748/wjg.v13.i44.5944
Published online Nov 28, 2007. doi: 10.3748/wjg.v13.i44.5944
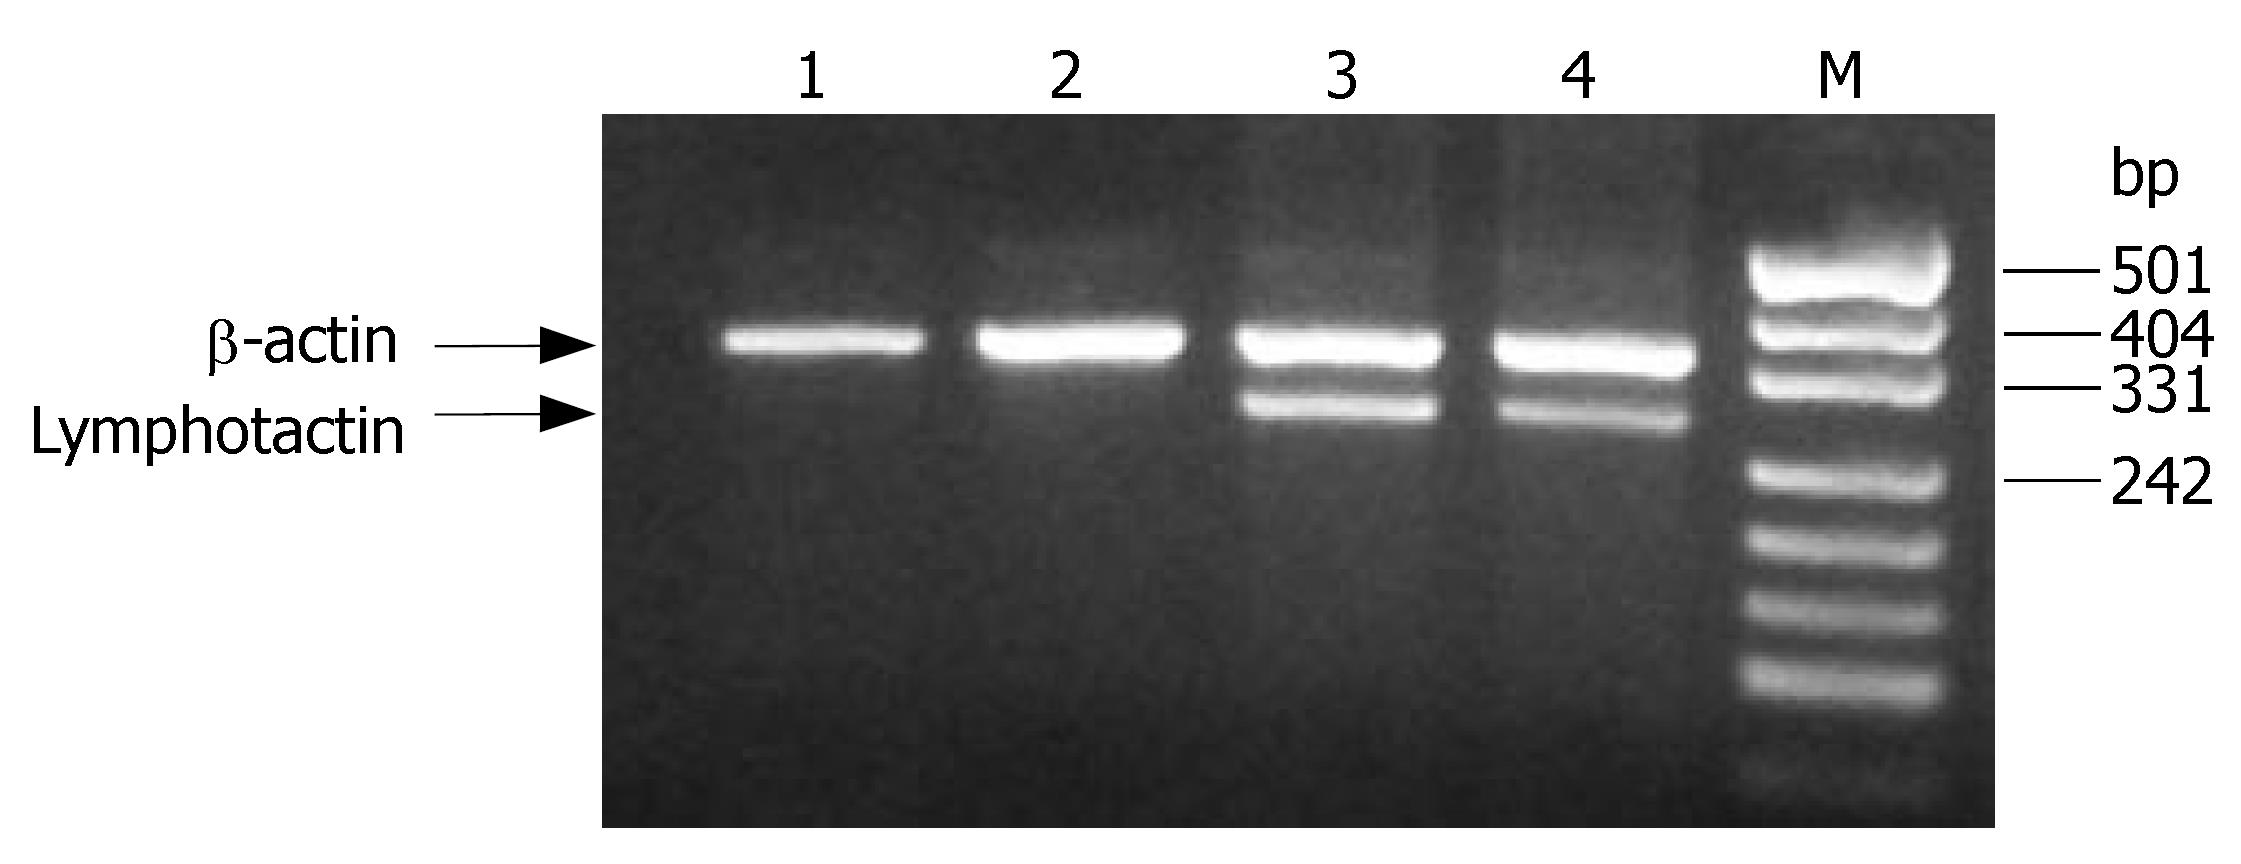
Figure 1 RT-PCR analysis of lymphotactin gene expression in DC, H22, DCLptn, H22Lptn (lanes 1-4).
The data shown are representative of three separate analyses for each cell population. M: Marker.
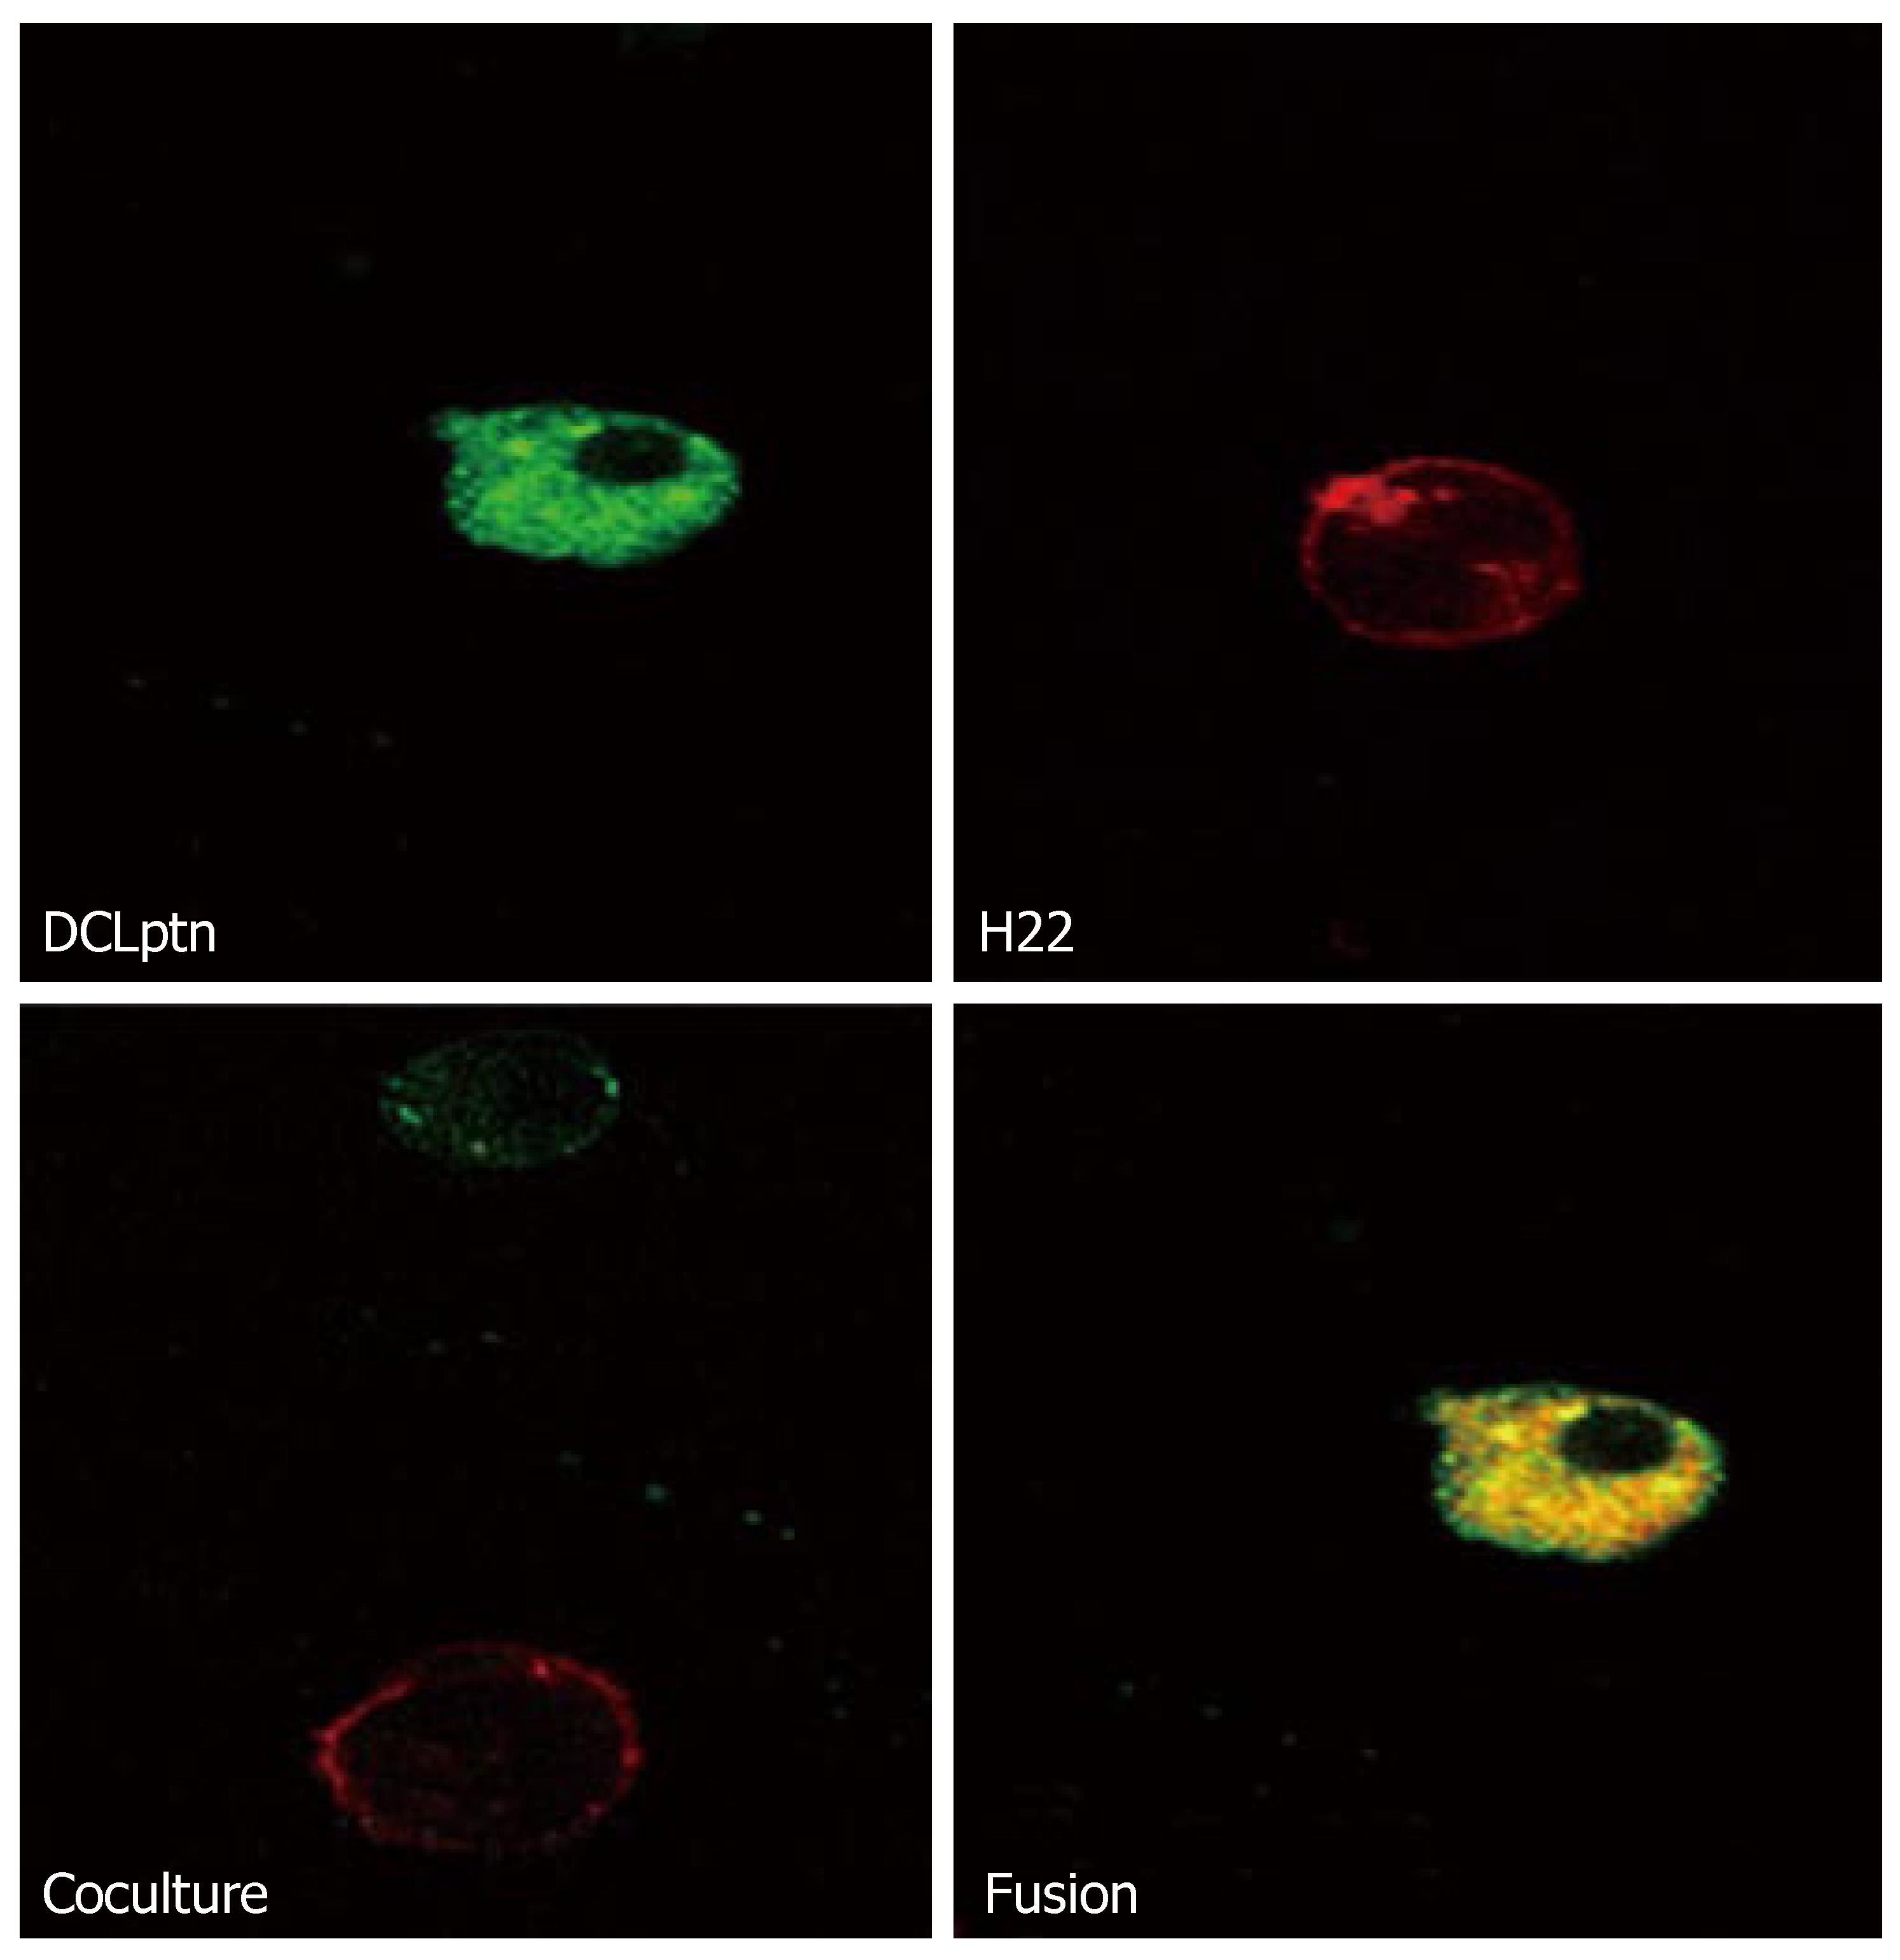
Figure 2 Confocal micrography of DCLptn/H22 fusion cells.
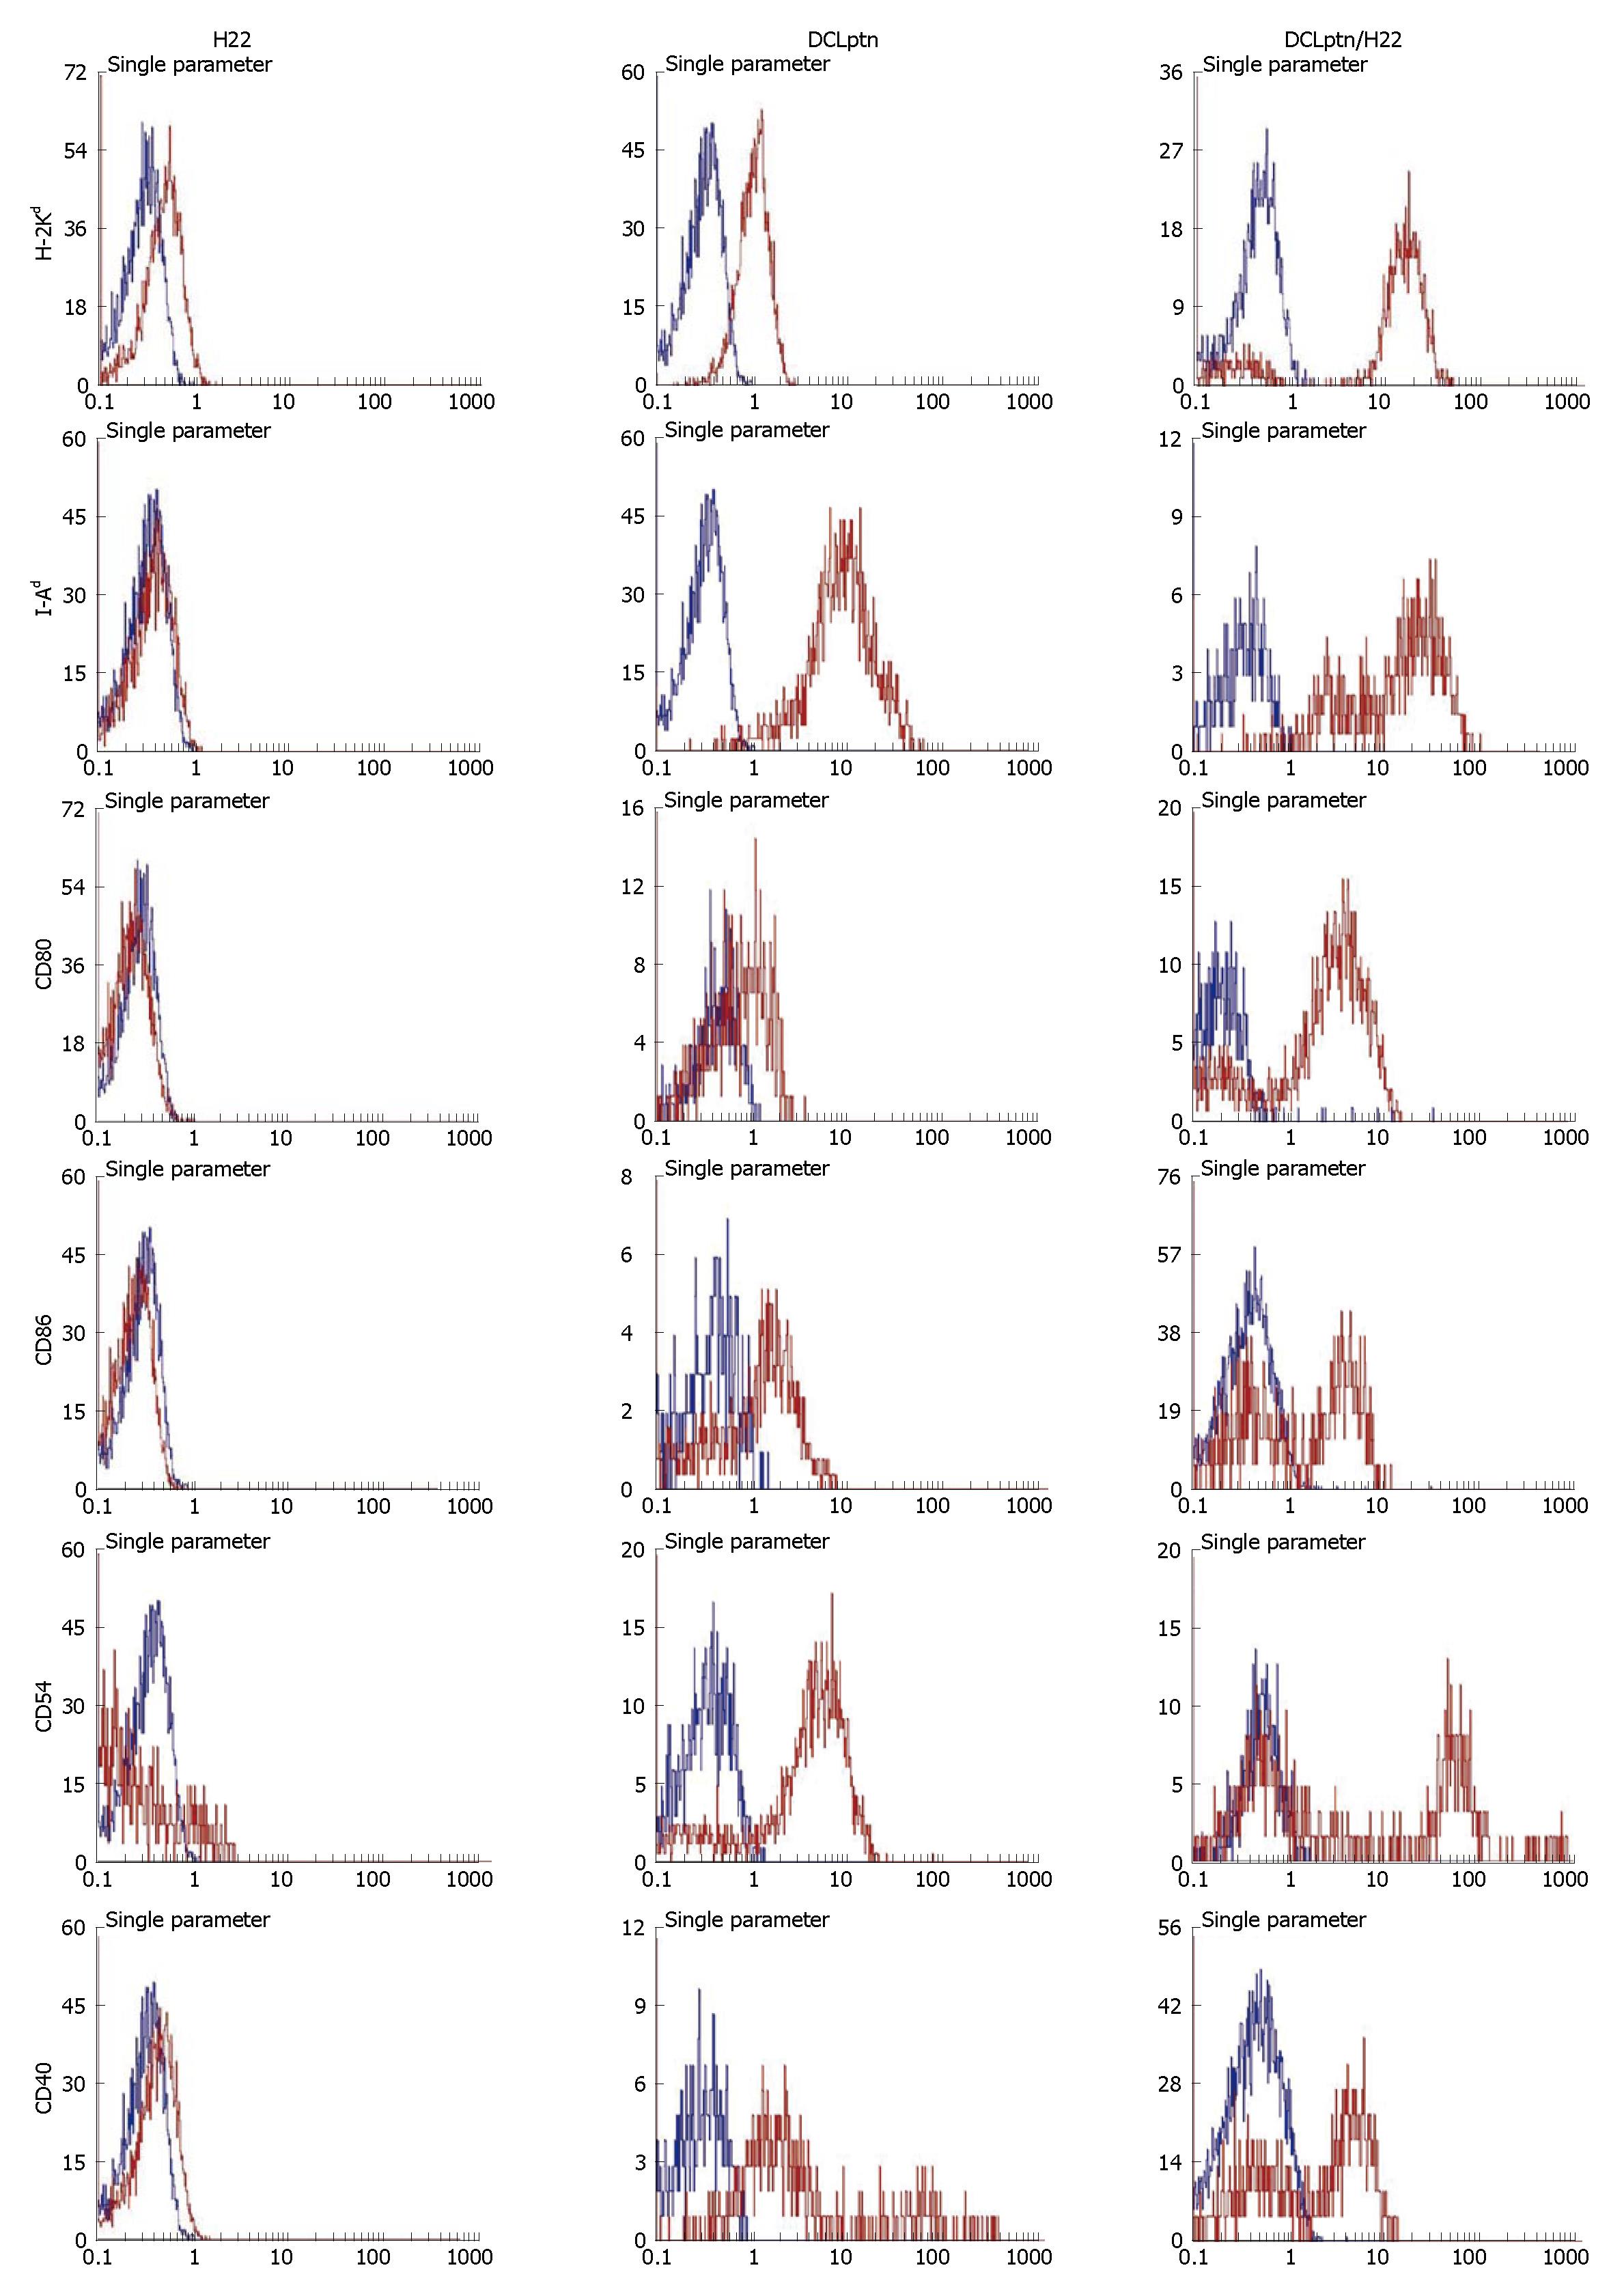
Figure 3 FACS analysis of the phenotypes of H22, DCLptn and DCLptn/H22 fusion cells.
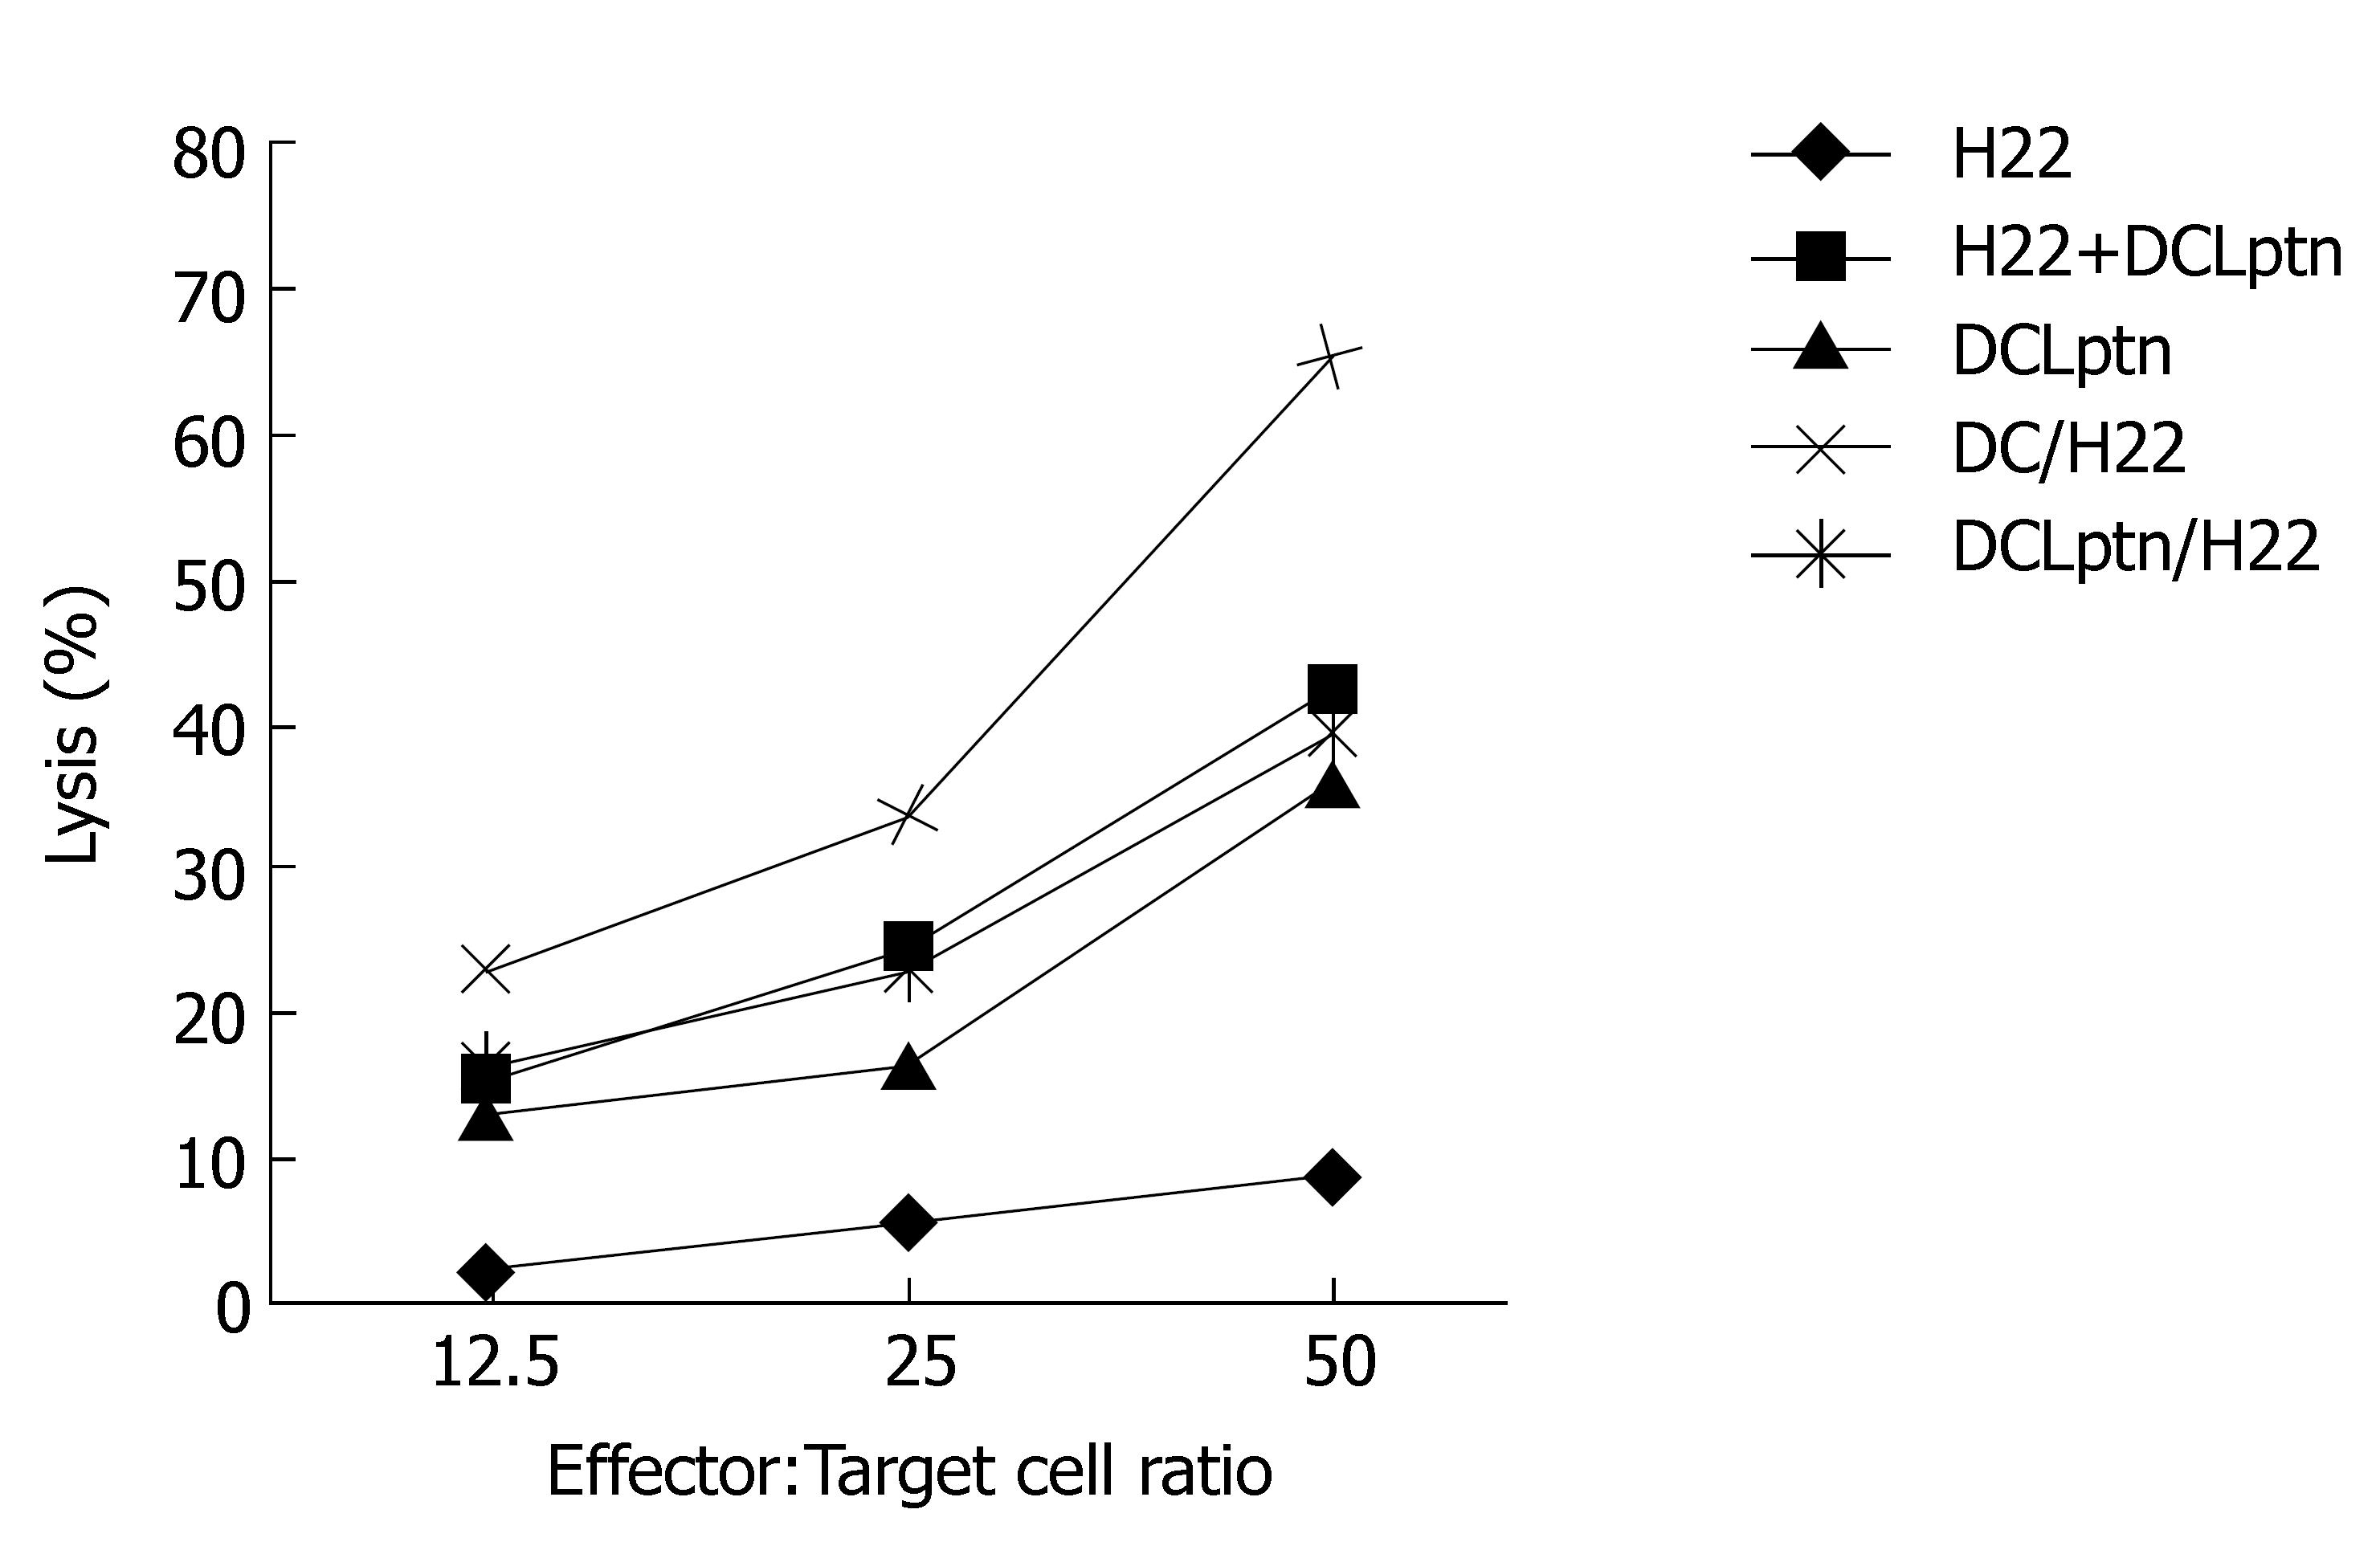
Figure 4 Stimulation of anti-tumor CTLs by DCLptn/H22 cells.
-
Citation: Sheng XL, Zhang H.
In-vitro activation of cytotoxic T lymphocytes by fusion of mouse hepatocellular carcinoma cells and lymphotactin gene-modified dendritic cells. World J Gastroenterol 2007; 13(44): 5944-5950 - URL: https://www.wjgnet.com/1007-9327/full/v13/i44/5944.htm
- DOI: https://dx.doi.org/10.3748/wjg.v13.i44.5944


