Copyright
©2007 Baishideng Publishing Group Co.
World J Gastroenterol. Nov 28, 2007; 13(44): 5813-5821
Published online Nov 28, 2007. doi: 10.3748/wjg.v13.i44.5813
Published online Nov 28, 2007. doi: 10.3748/wjg.v13.i44.5813
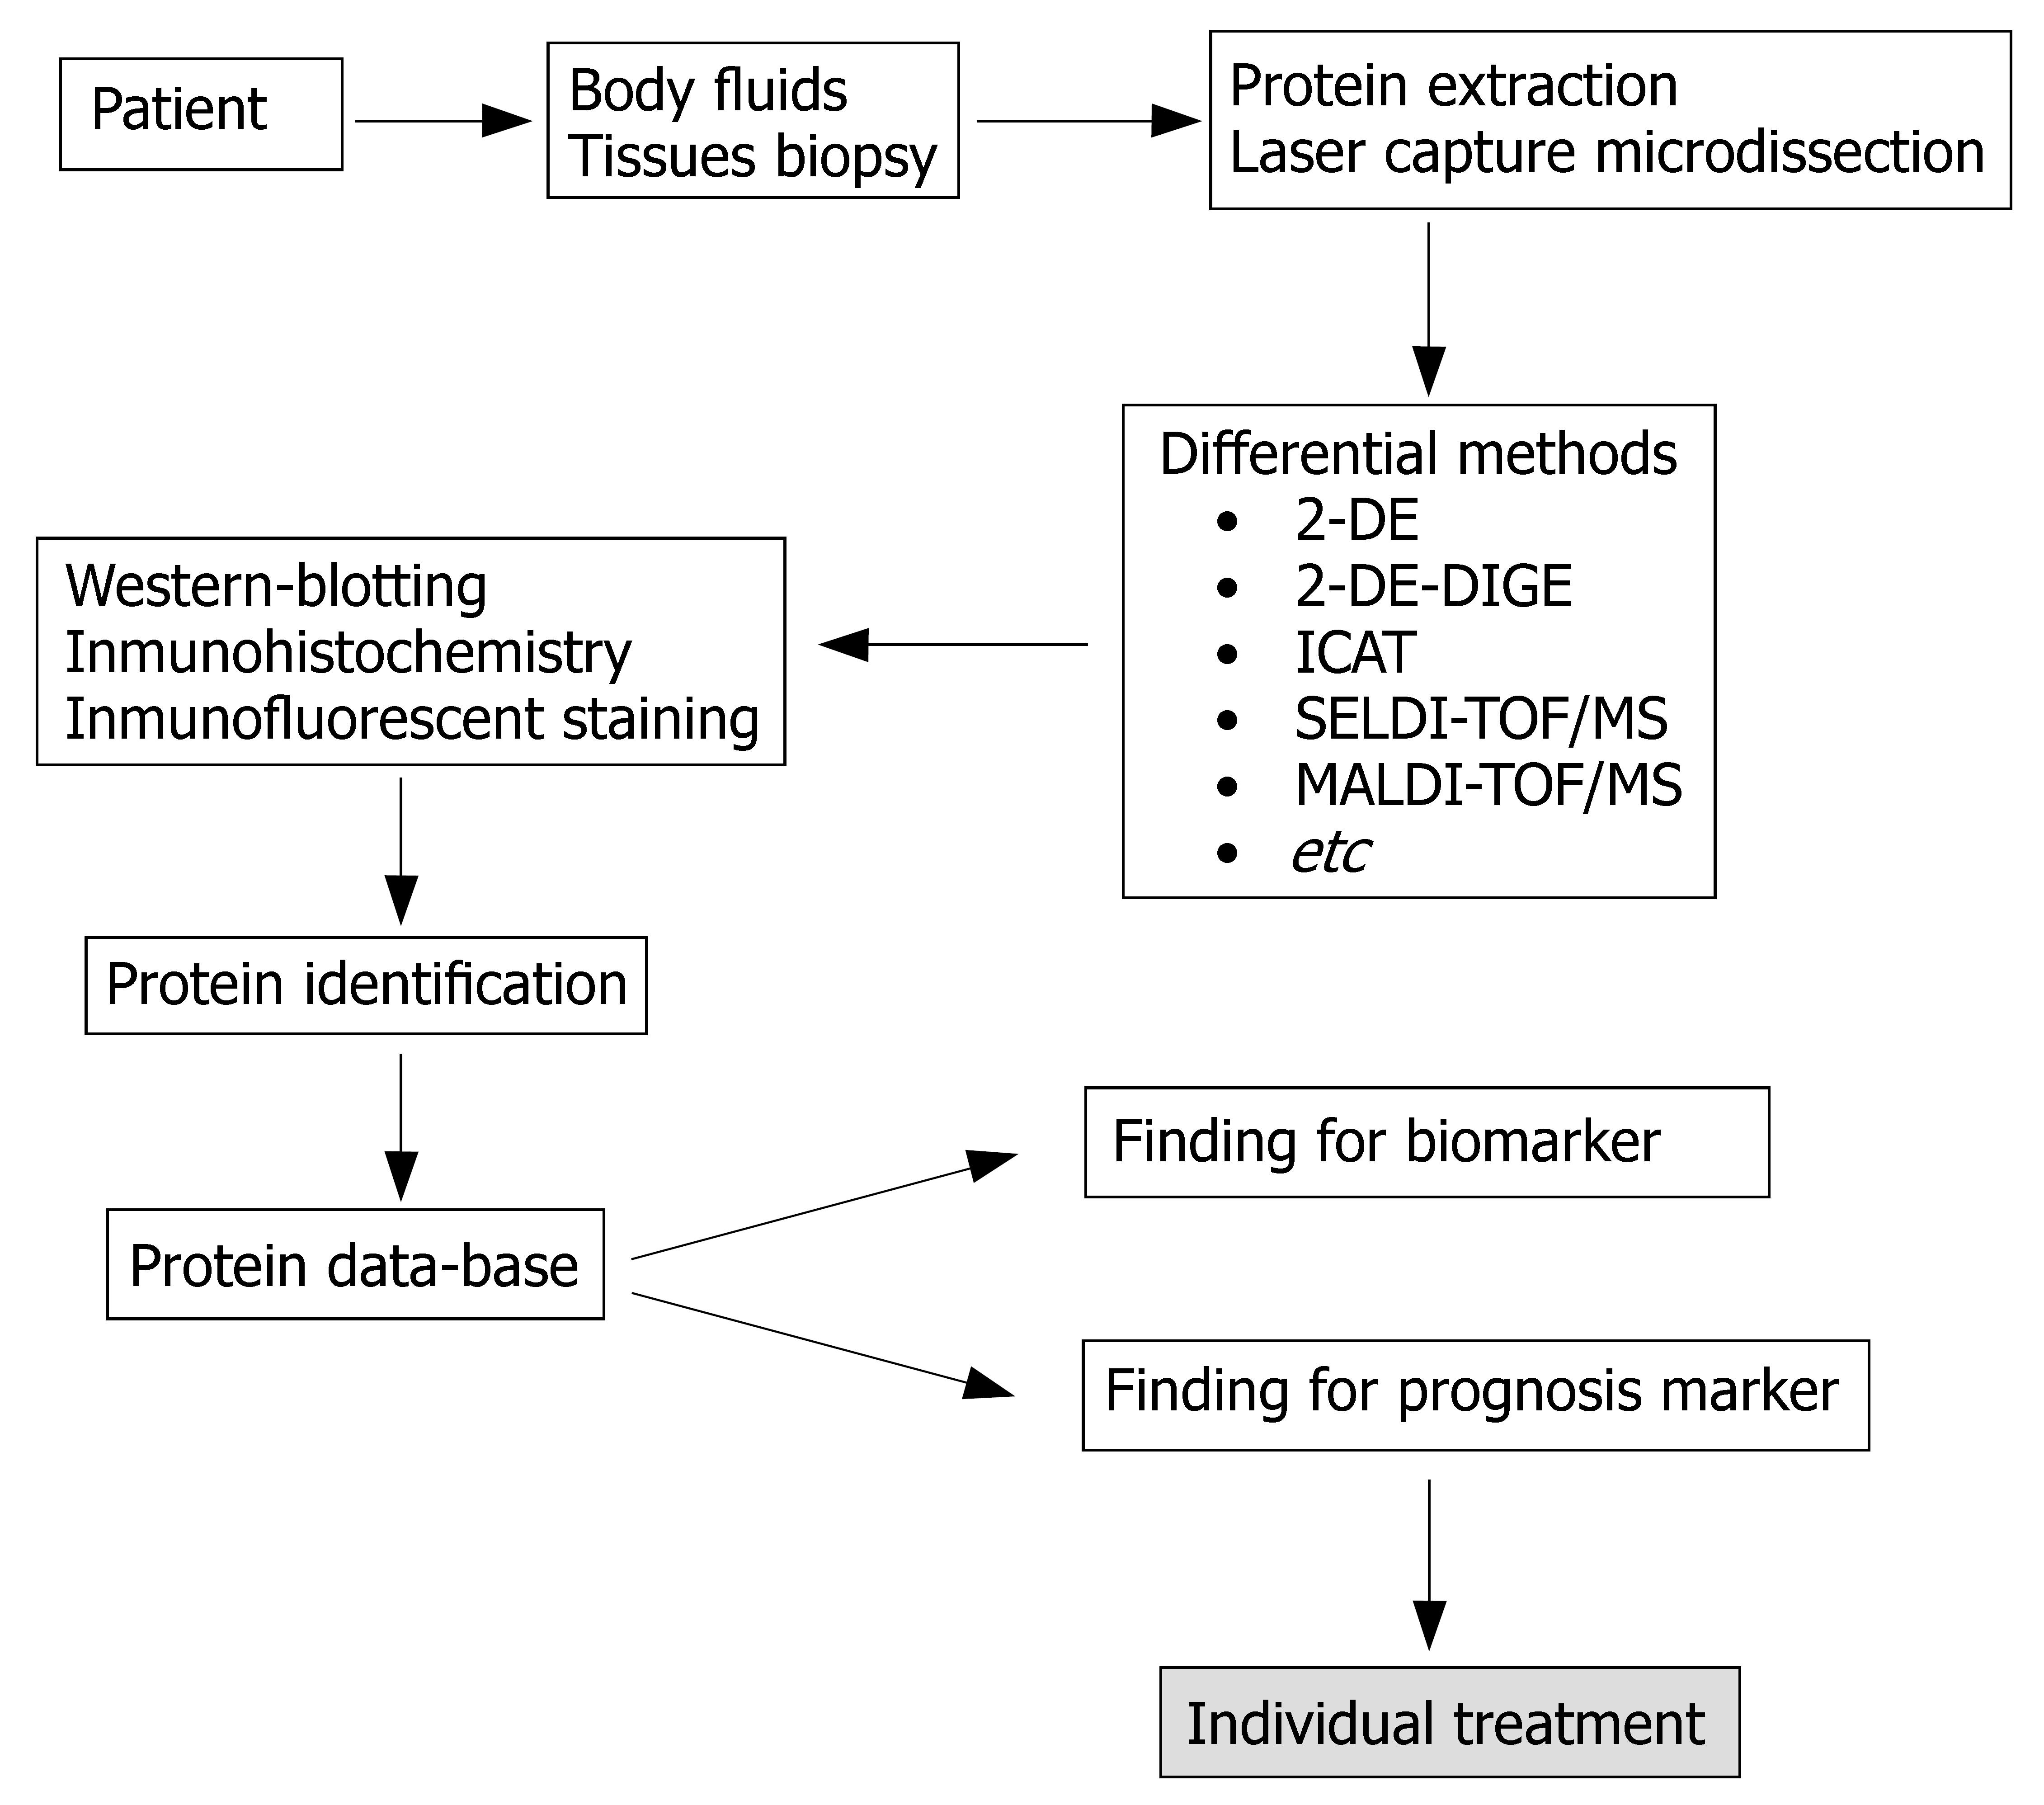
Figure 1 Proteomic differential display methods.
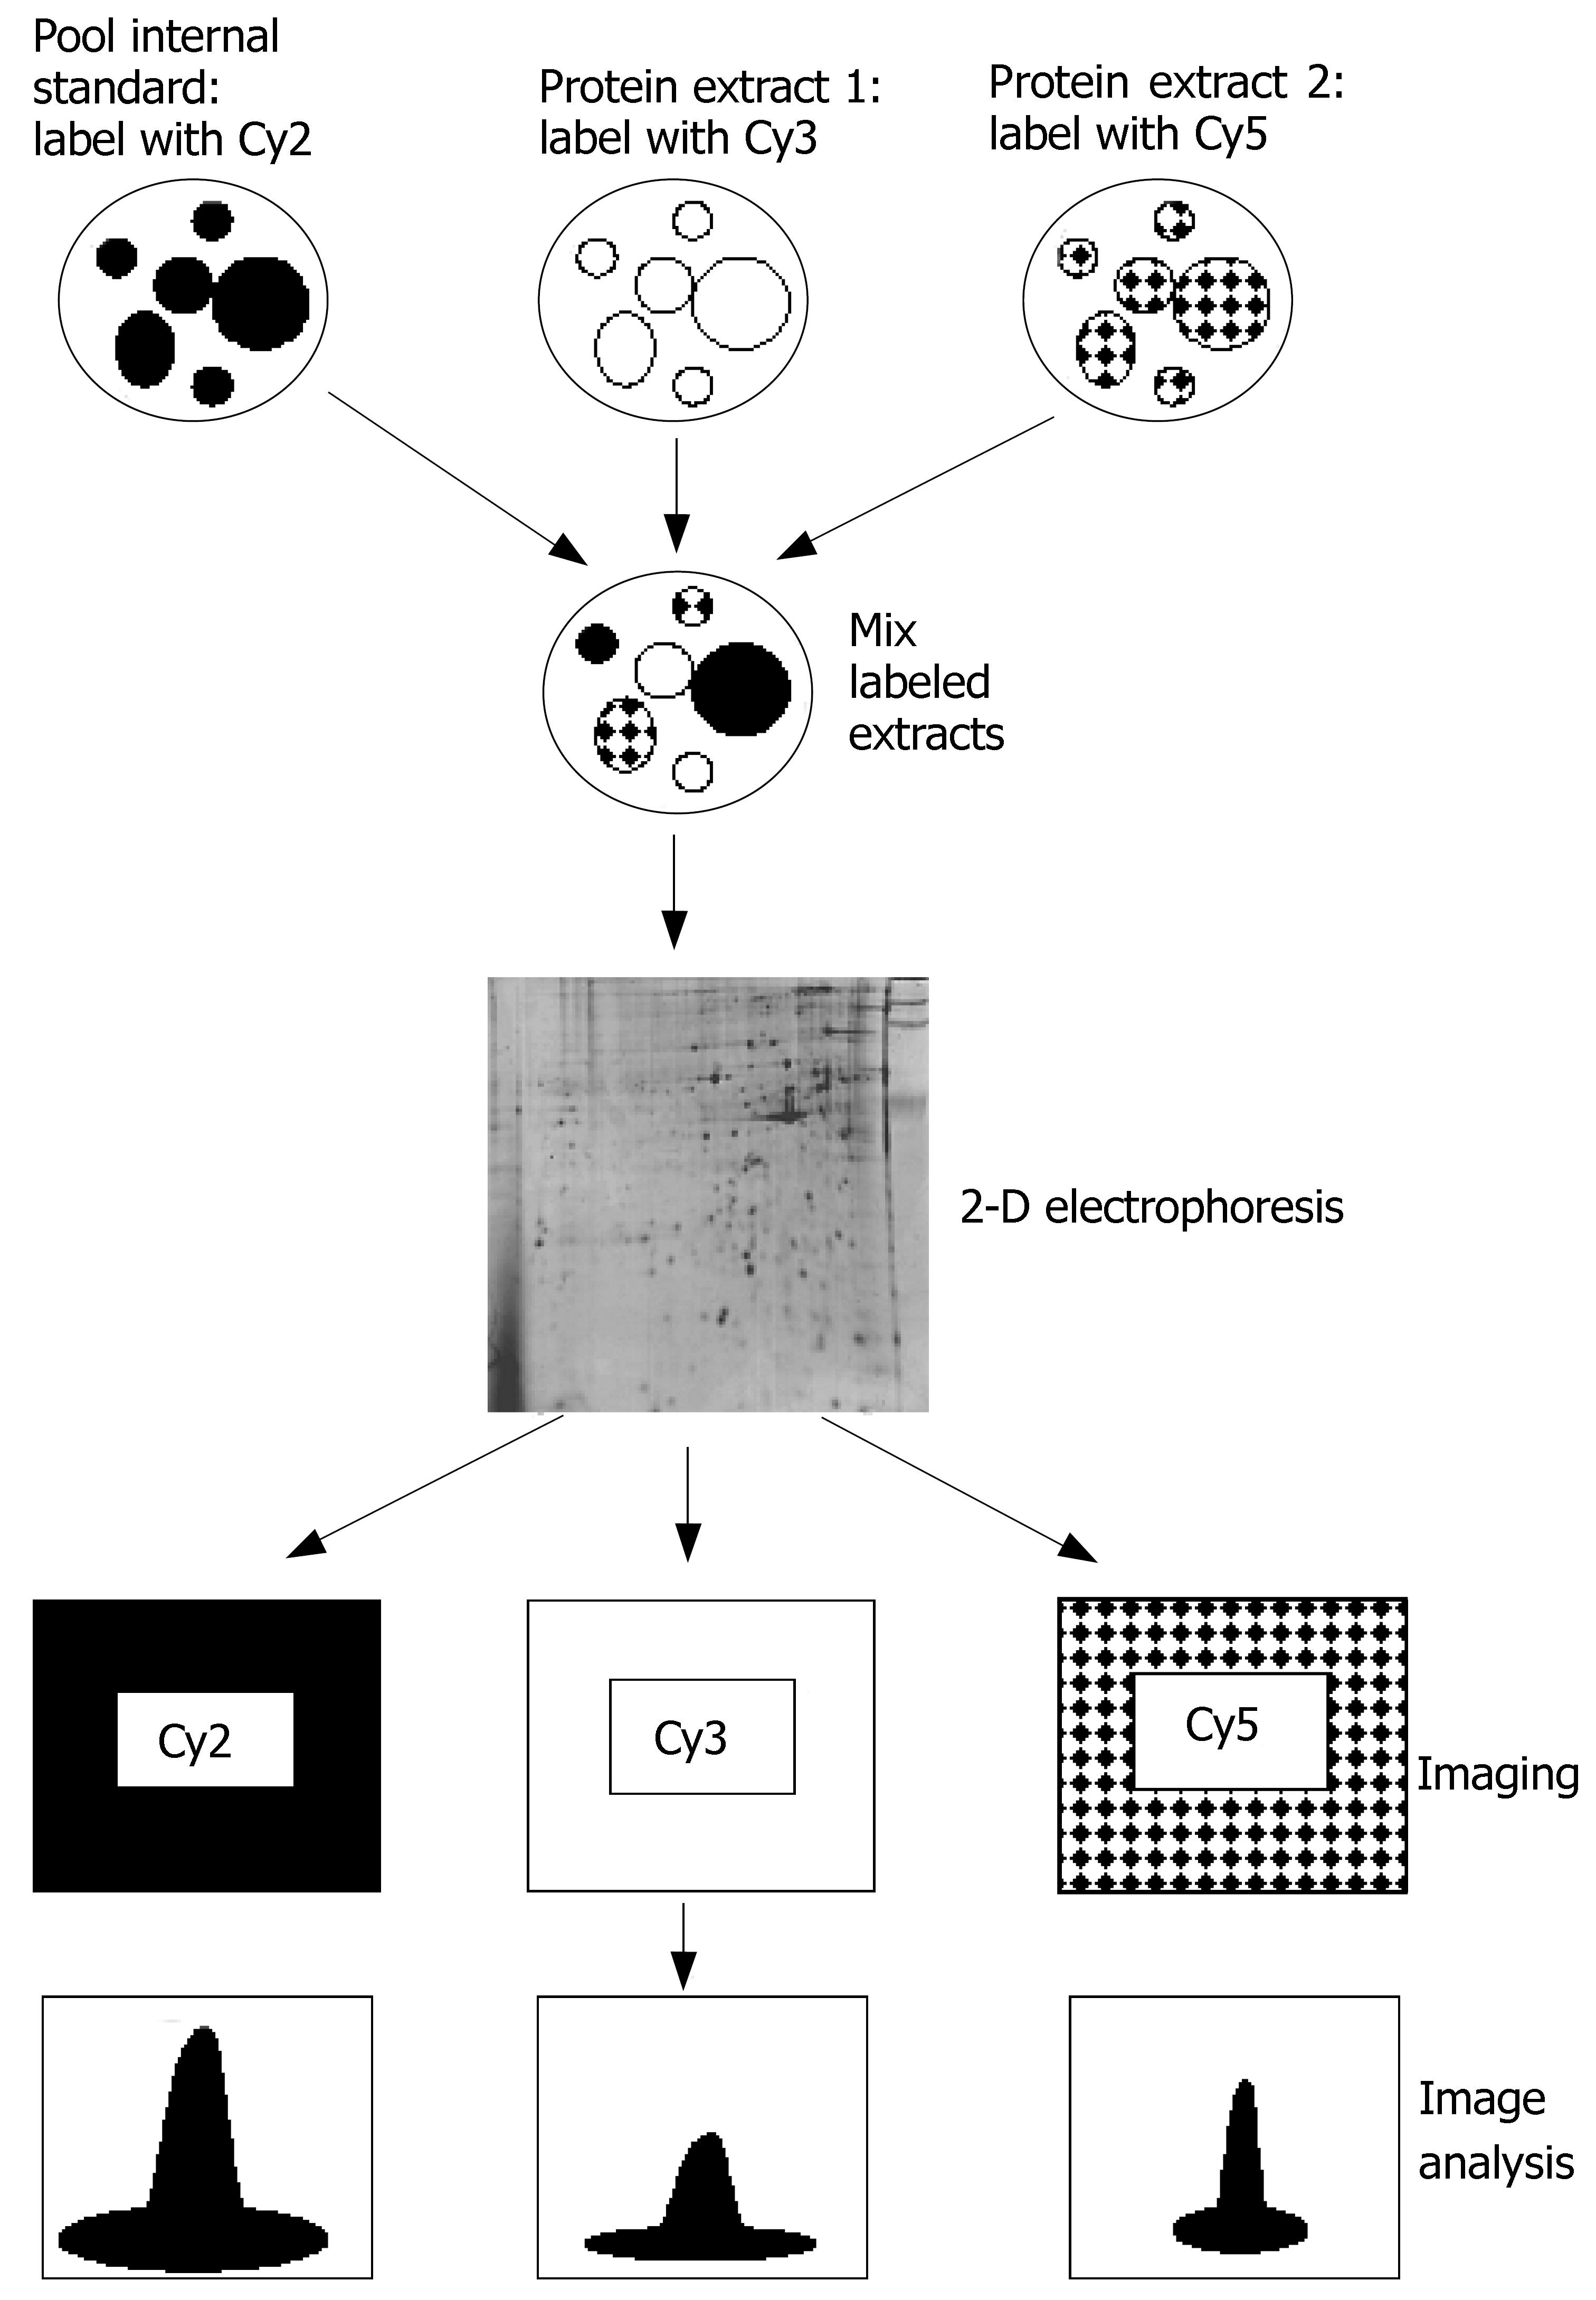
Figure 2 2D-DIGE techniques.
Cy2, Cy3 and Cy5 are different fluorescent dyes.
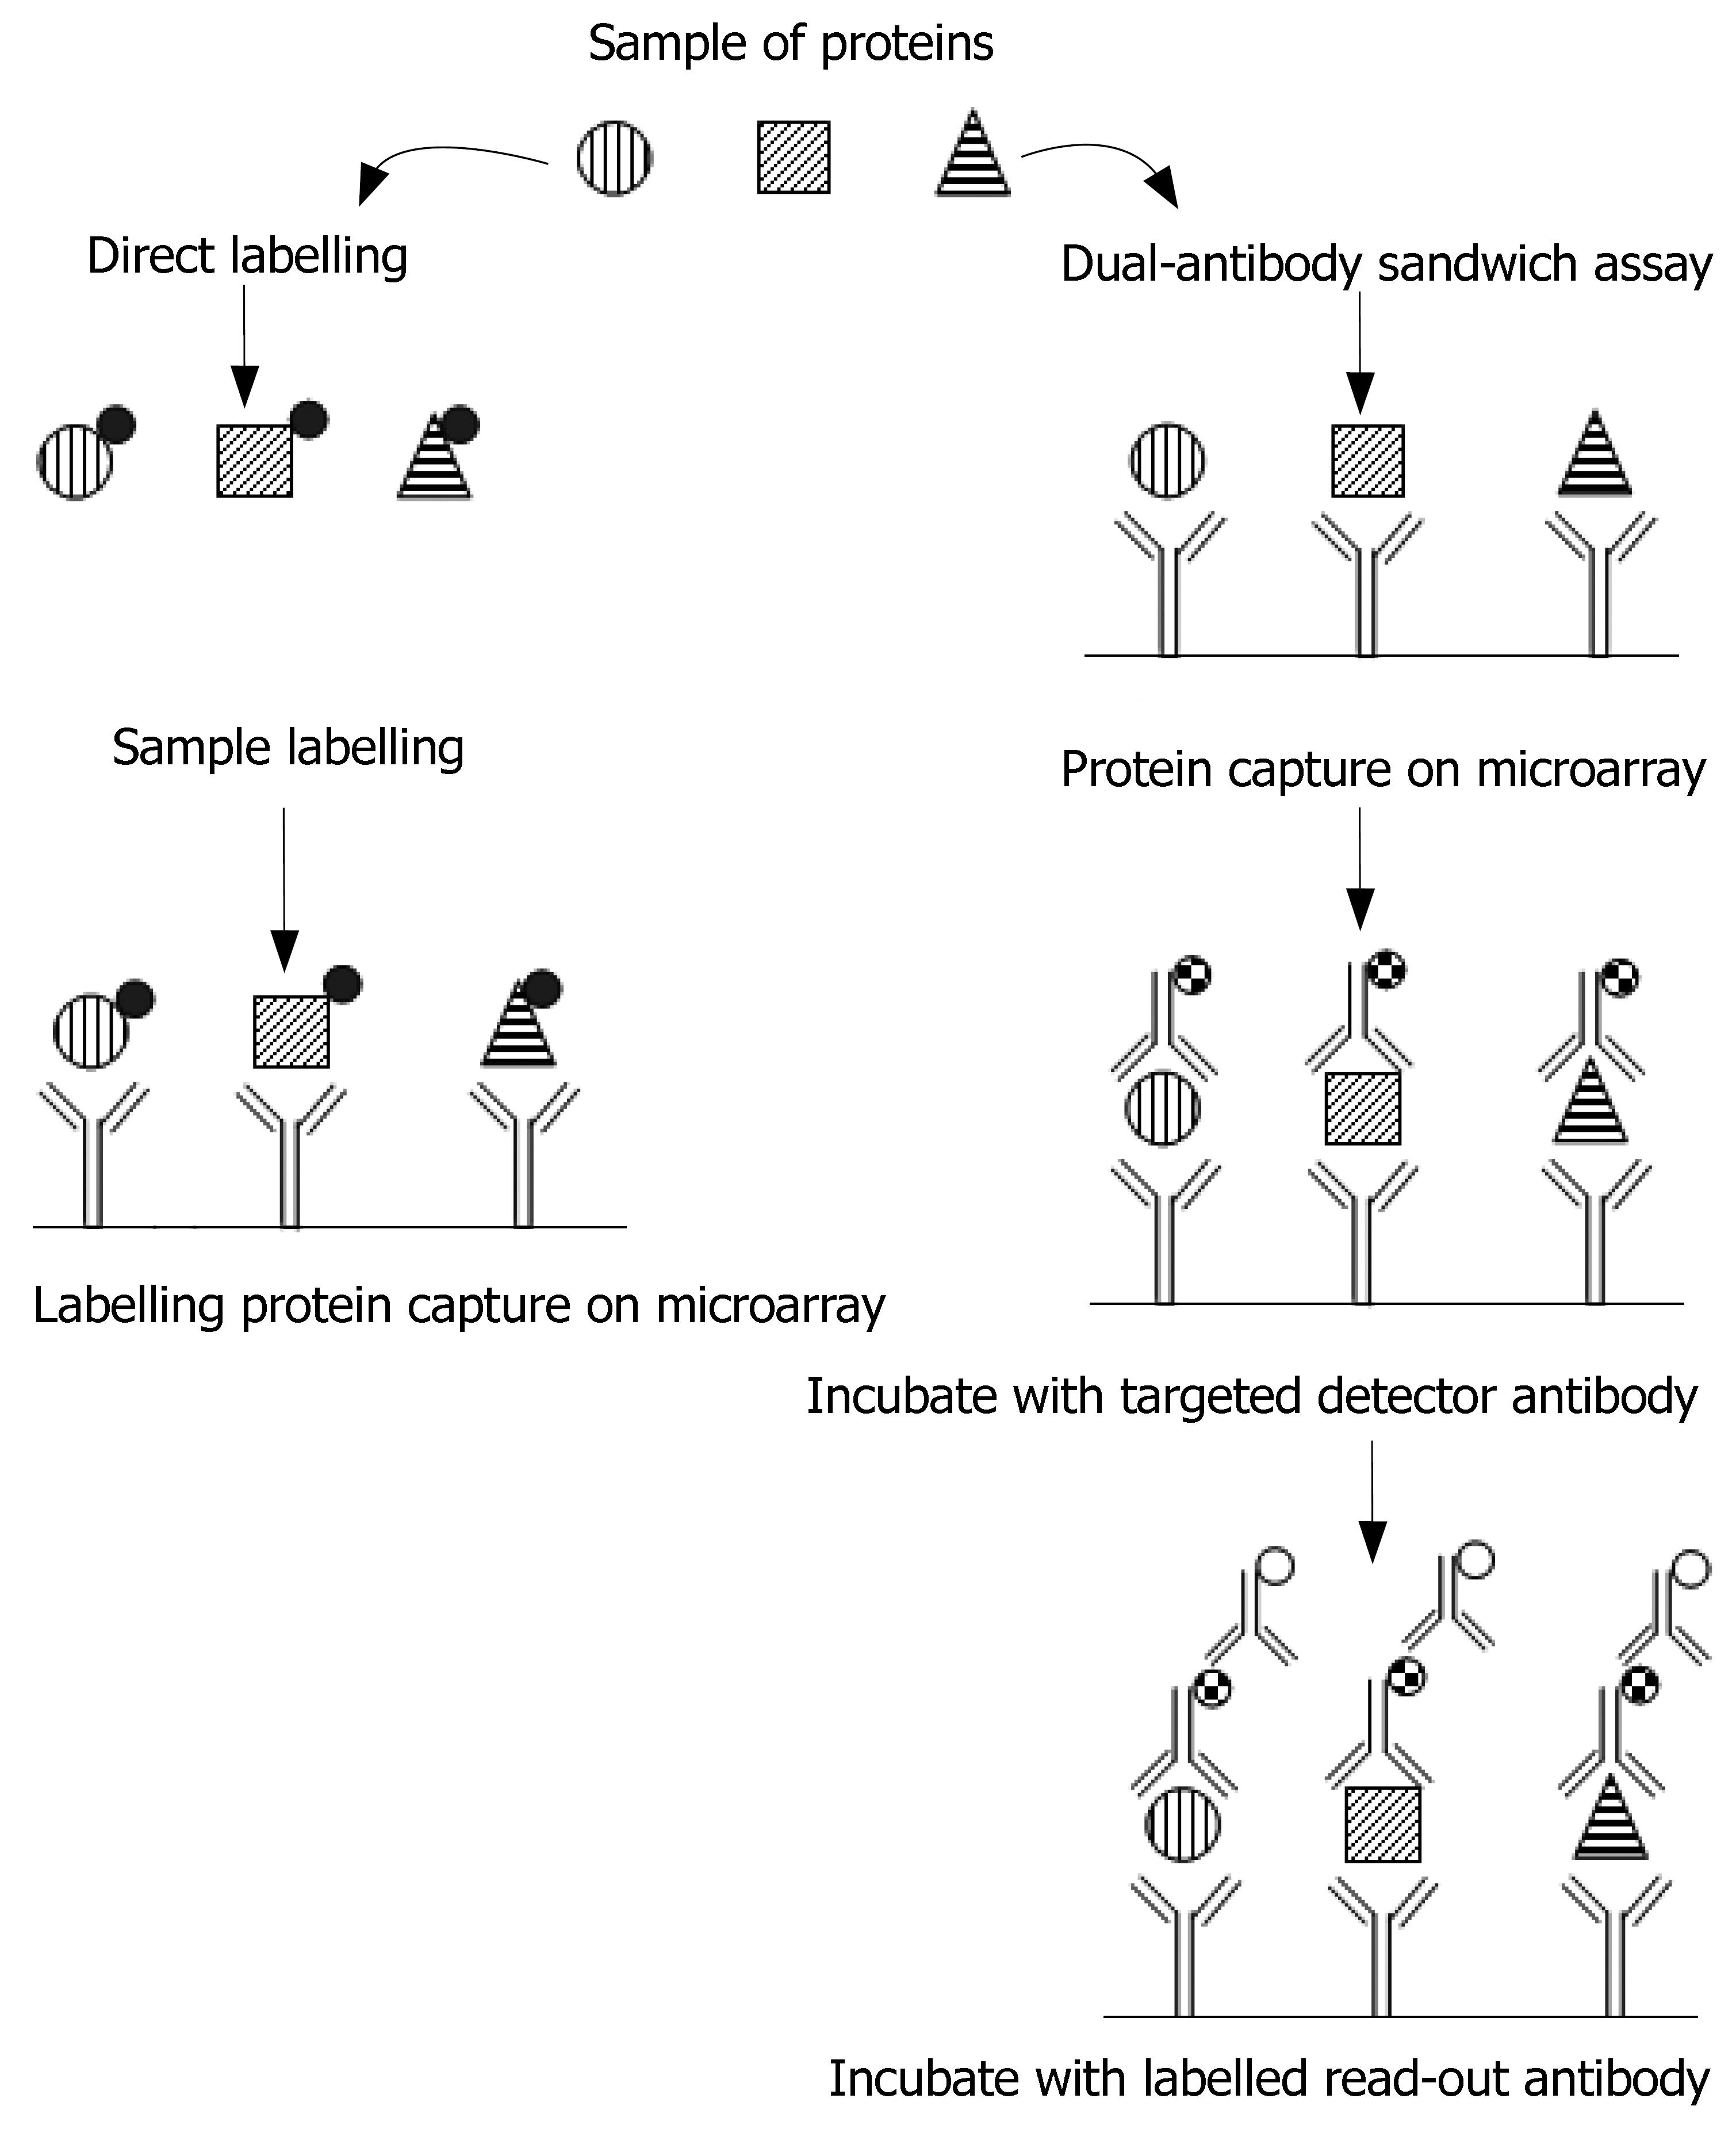
Figure 3 Representation of the two antibody microarray experimental formats.
Direct labelling: single-capture antibody experiments; all proteins in a sample are labelled (black circles) thereby providing a means for detecting bound proteins following incubation on an antibody microarray. Dual-antibody (capture and read-out antibody) sandwich immunoassays: proteins captured on an antibody microarray are detected by a cocktail of tagged detection antibodies, which are matched to the spotted antibodies. The detector antibody tag is then measured by binding of a labelled (empty circles) read-out antibody.
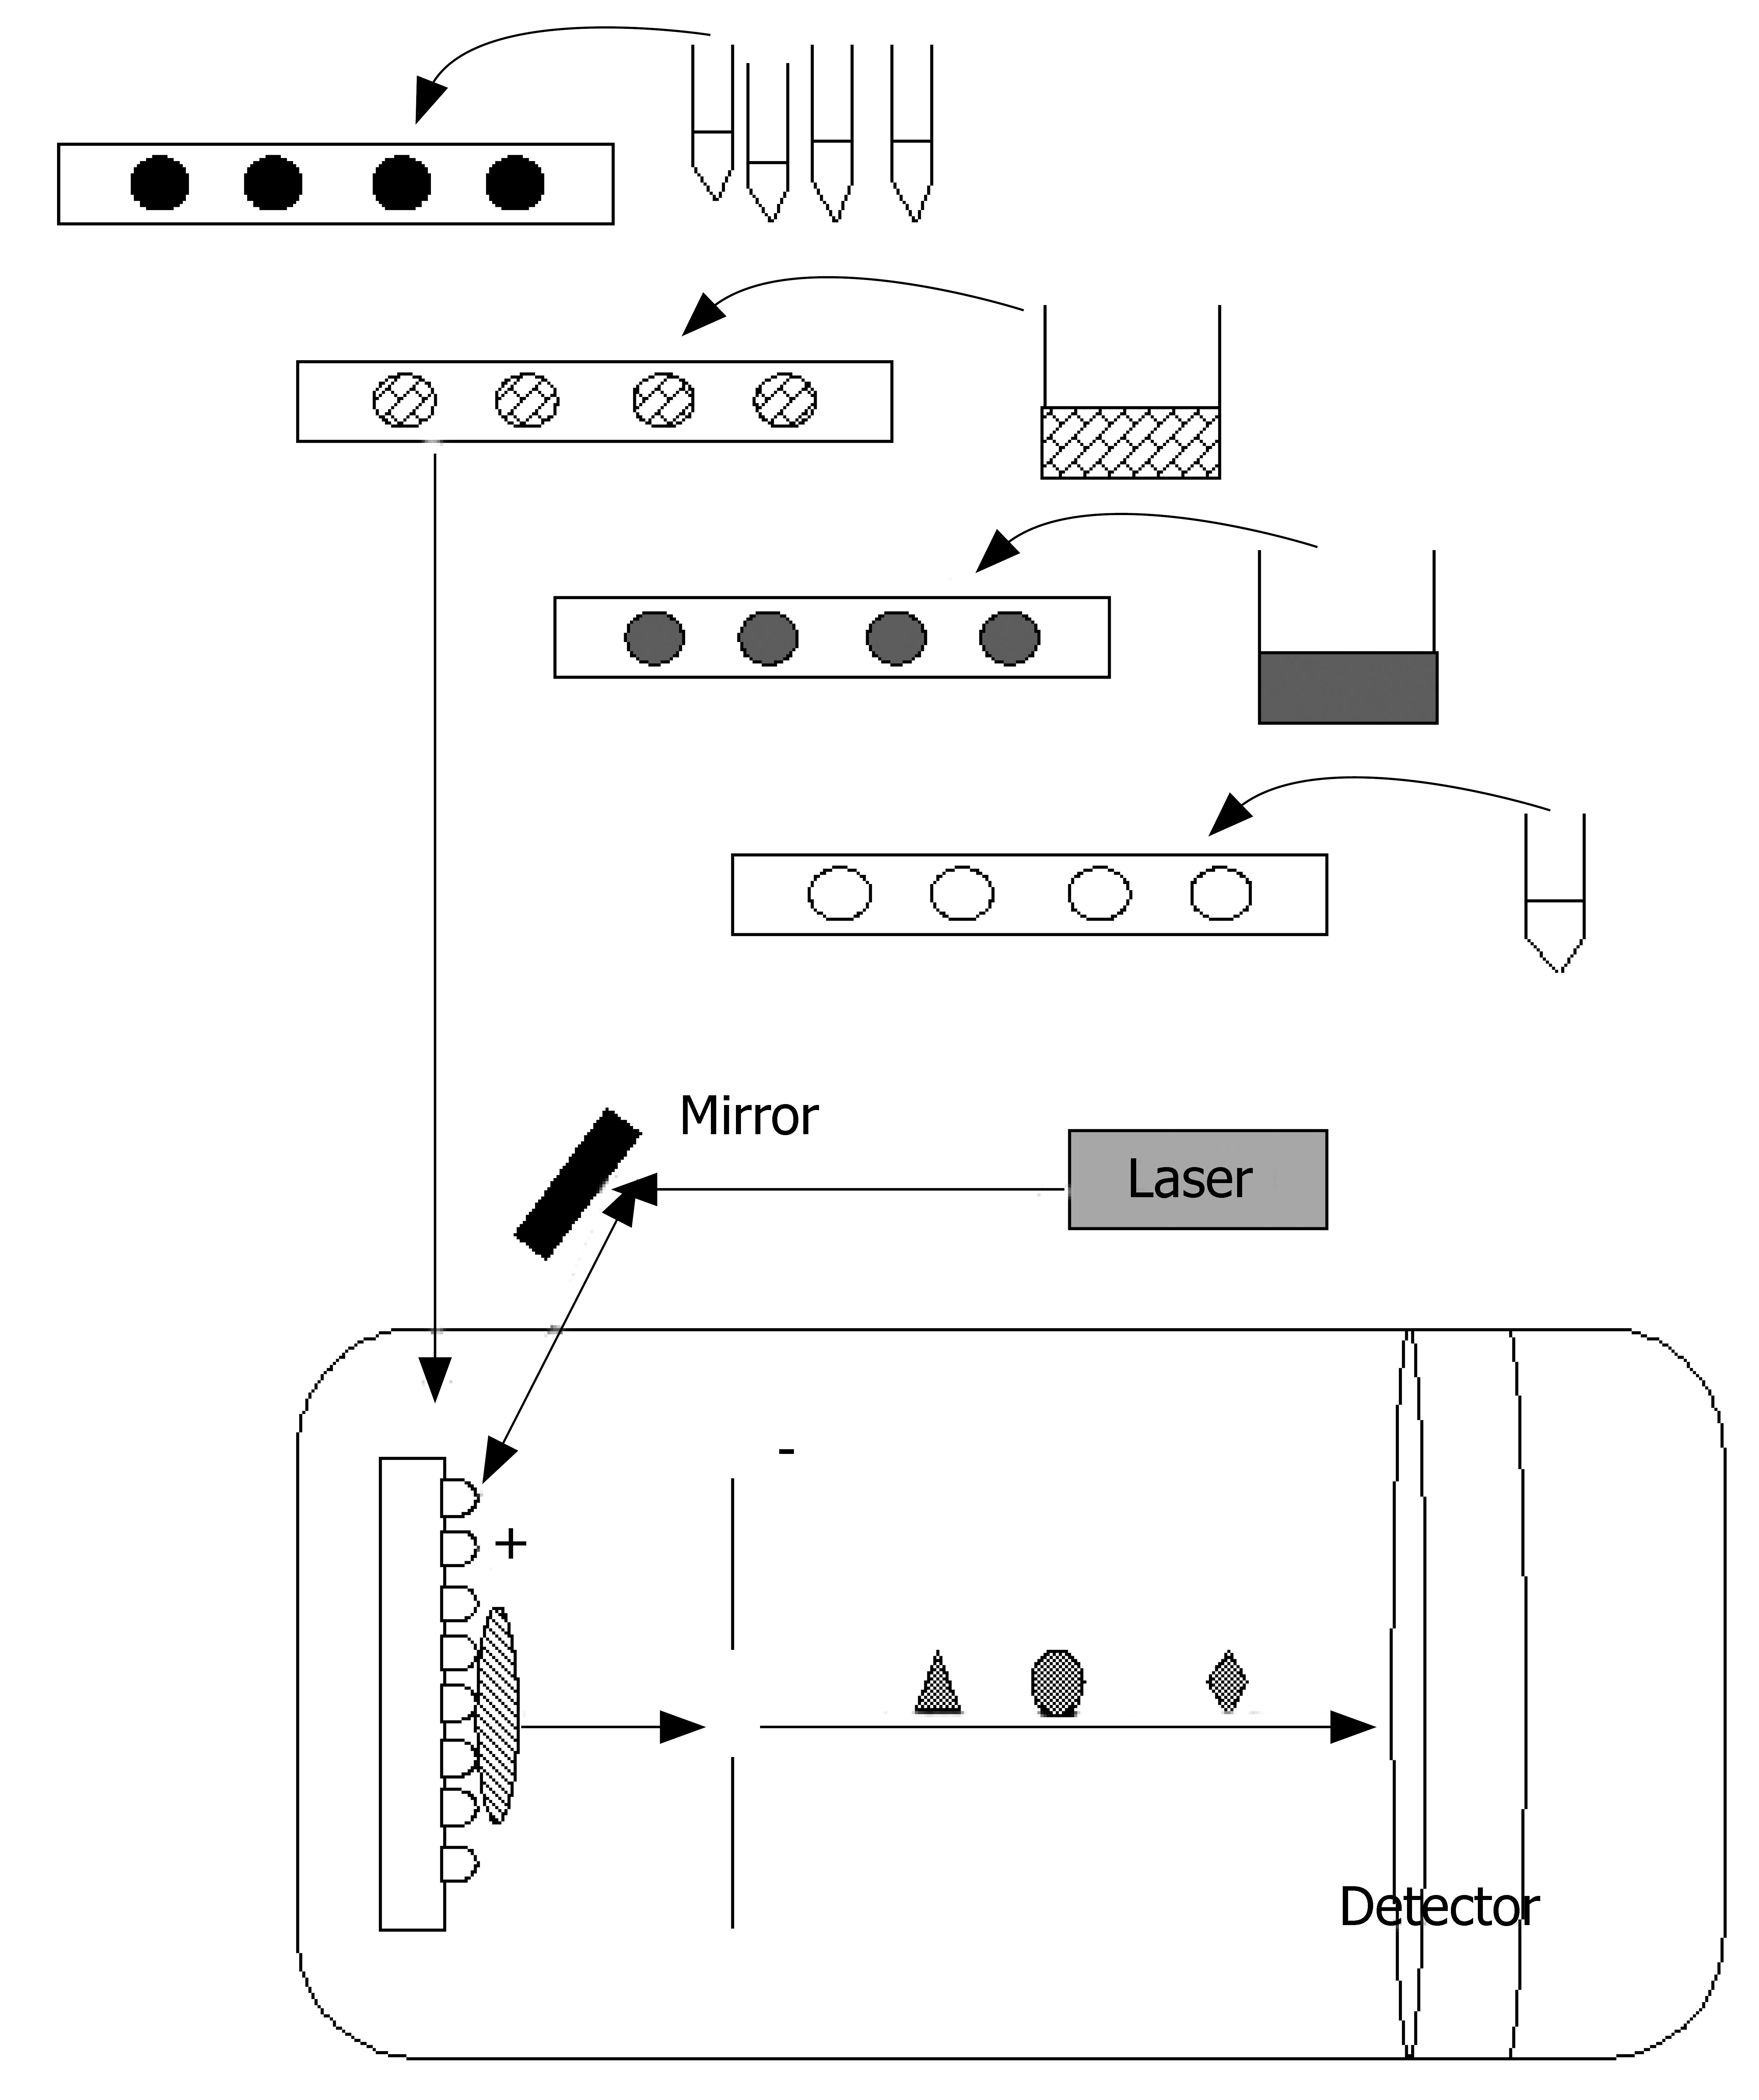
Figure 4 Principles of SELDI-TOF MS.
The application of sample from to an eight-spot array with hydrophilic, hydrophobic, cationic, anionic or immobilized-metal affinity capture chromatography surface (black colour). The addition of an appropriate binding buffer (purple colour). On-chip sample purification using one or more wash buffers (grey colour). The application of energy-absorbing matrix for the absorption of laser energy (empty colour). Laser irradiation desorbs bound proteins and positively ionizes them. Owing to the electric field, they migrate in the mass analyser: (small diamond) and multiply charged proteins (oval) faster than large and single-charged ones (triangle). Thus, the proteins are separated. Time of flight (t) is proportional to protein mass per charge.
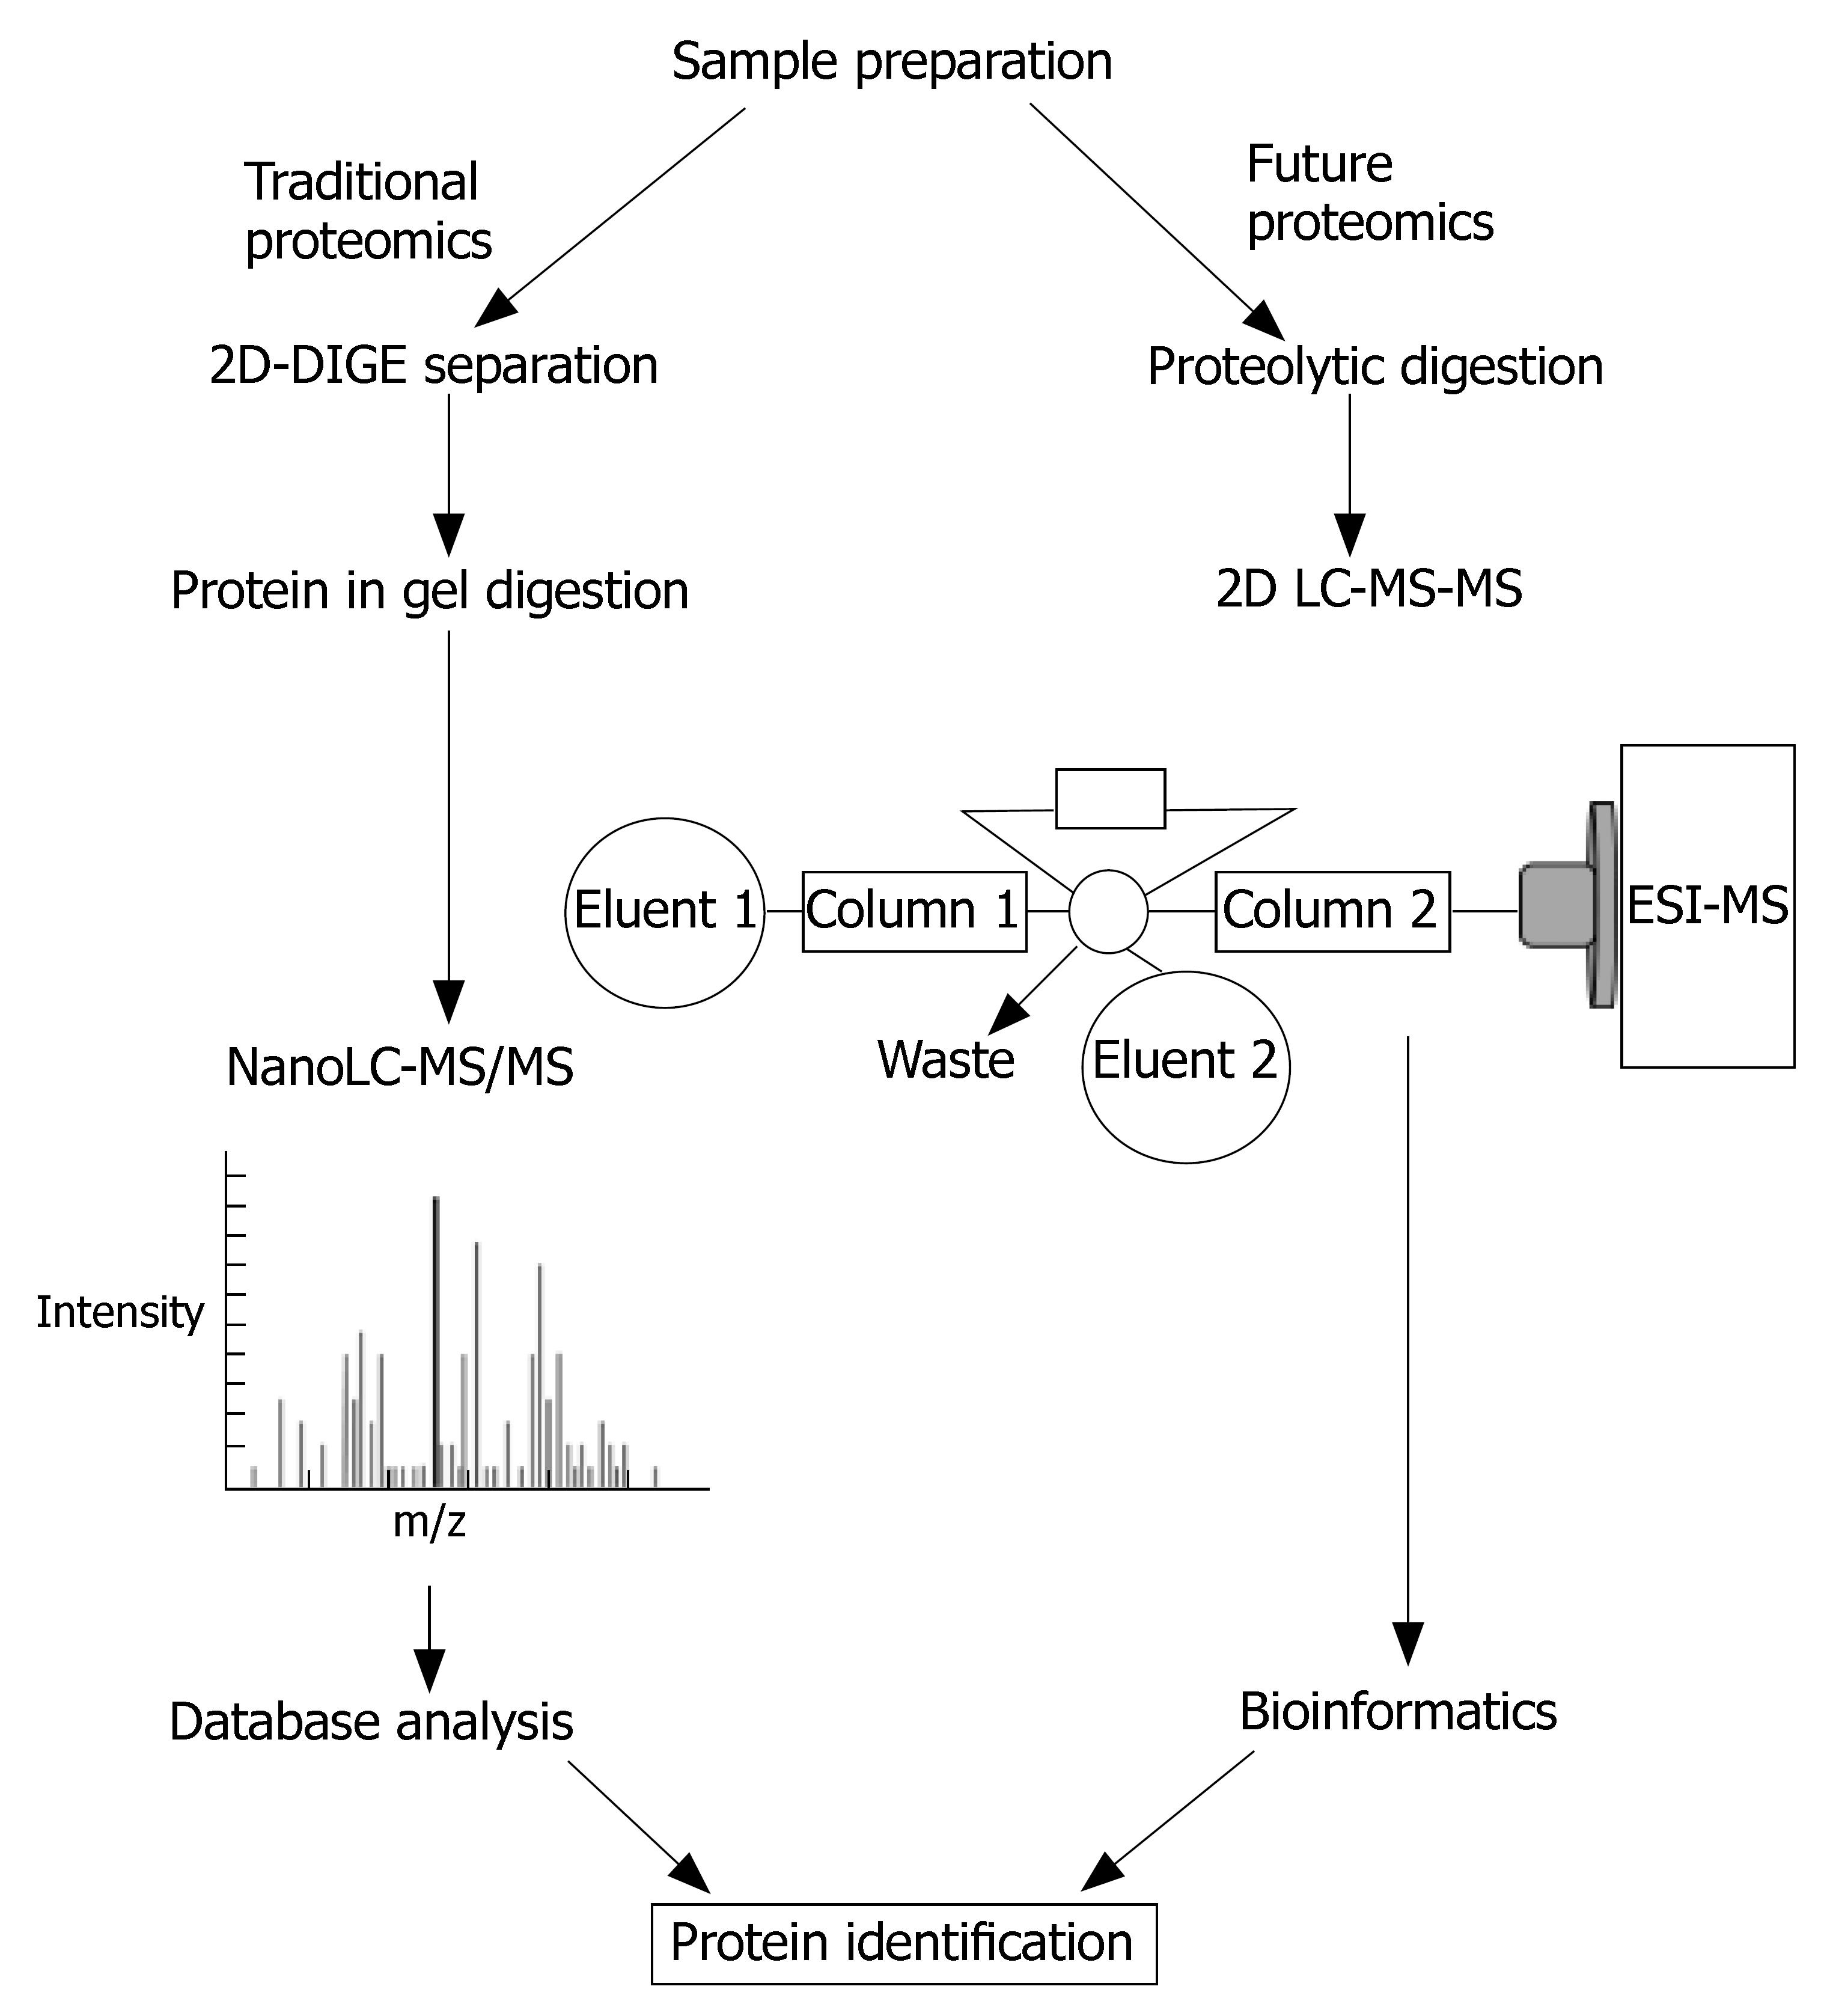
Figure 5 Different strategies for proteomic studies.
- Citation: Bitarte N, Bandrés E, Zárate R, Ramirez N, Garcia-Foncillas J. Moving forward in colorectal cancer research, what proteomics has to tell. World J Gastroenterol 2007; 13(44): 5813-5821
- URL: https://www.wjgnet.com/1007-9327/full/v13/i44/5813.htm
- DOI: https://dx.doi.org/10.3748/wjg.v13.i44.5813


