Copyright
©2006 Baishideng Publishing Group Co.
World J Gastroenterol. Dec 21, 2006; 12(47): 7626-7634
Published online Dec 21, 2006. doi: 10.3748/wjg.v12.i47.7626
Published online Dec 21, 2006. doi: 10.3748/wjg.v12.i47.7626
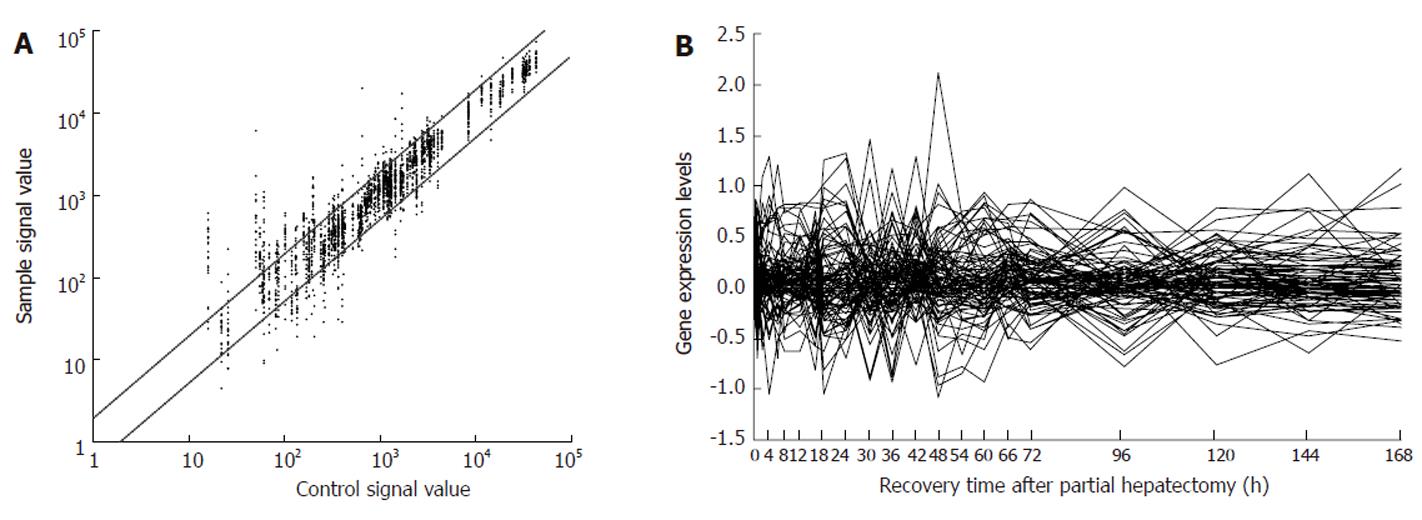
Figure 1 Expression files of 88 hepatitis virus infection-associated genes in rat liver regeneration.
A: The abundance and frequency of gene expression, each point represents the signal value of one gene at the corresponding time point. The dots above bias indicate that the genes are more than two-fold up-expressed, the dots under bias indicate that the genes are more than two-fold down-expressed, and the dots between biases indicate that the genes have no alteration in expression. The more far genes are from the bias, the longer the time the greater the gene change; B: Expression changes in genes associated with LR.
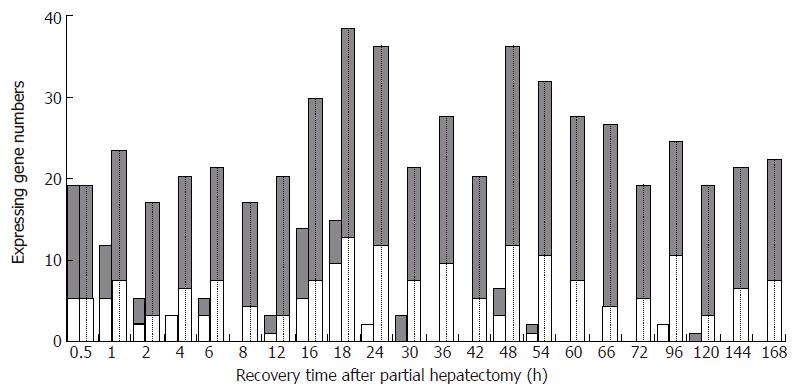
Figure 2 The initial and total expression profiles of 88 hepatitis virus infection-associated genes at each time point of liver regeneration.
Blank bars: the number of initially expressed genes; Dotted bars: the number of totally expressed genes; Grey bars: up-regulated genes; White bars: down-regulated genes.
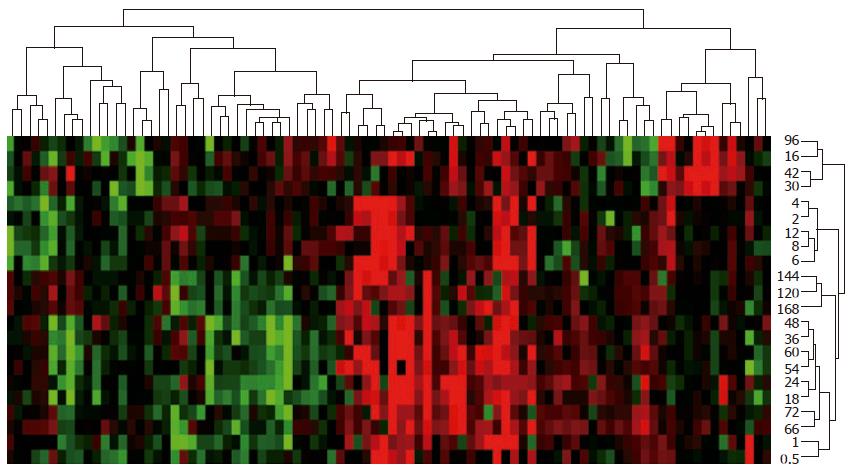
Figure 3 Expression and time series clusters of 88 hepatitis virus infection-associated genes during liver regeneration.
Detection data of rat genome 230 2.0 array were analyzed by H-clustering. Red: up-regulated genes; Green: down-regulated genes; Black: no-sense genes in expression; Upper and right trees showing expression and time series clusters, respectively.
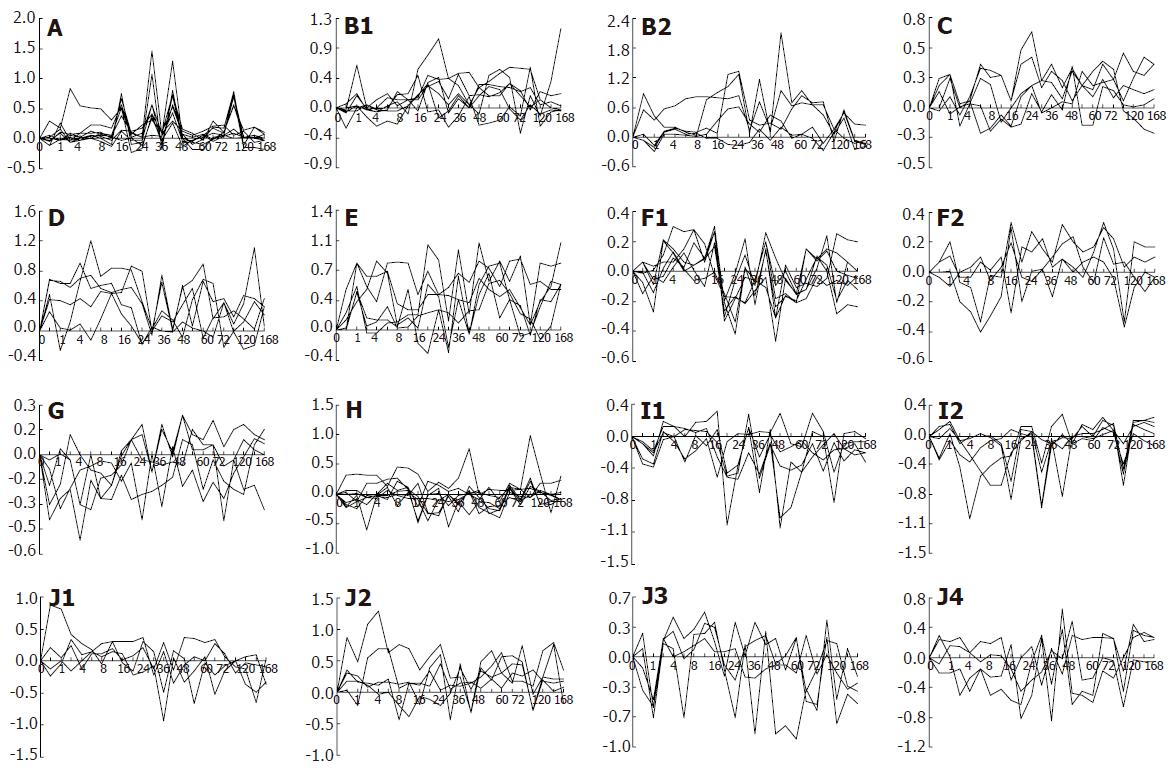
Figure 4 Expression patterns of 88 hepatitis virus infection-associated genes during liver regeneration.
Expression patterns of these genes exhibit 23 types. A-E: up-regulated expression; F-I: down-regulated expression; J: up/down-regulated expression. X-axis represents recovery time after PH (h), Y-axis shows logarithm ratio of the signal values of genes at each time point to control.
- Citation: Su LJ, Ding GW, Yang ZL, Zhang SB, Yang YX, Xu CS. Expression patterns and action analysis of genes associated with hepatitis virus infection during rat liver regeneration. World J Gastroenterol 2006; 12(47): 7626-7634
- URL: https://www.wjgnet.com/1007-9327/full/v12/i47/7626.htm
- DOI: https://dx.doi.org/10.3748/wjg.v12.i47.7626


