Copyright
©2006 Baishideng Publishing Group Co.
World J Gastroenterol. Jul 21, 2006; 12(27): 4352-4358
Published online Jul 21, 2006. doi: 10.3748/wjg.v12.i27.4352
Published online Jul 21, 2006. doi: 10.3748/wjg.v12.i27.4352
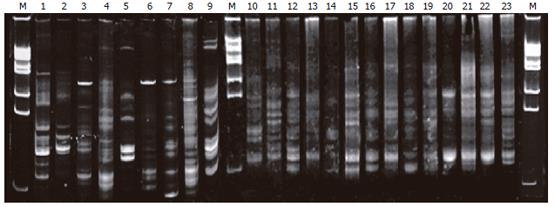
Figure 1 Gut bacterium colony DNA fingerprint profiles.
Lane M: Marker; lanes 1-2: normal group; lanes 3-9: PN group; lanes 10-16: EN group; lanes 10-16: Probiotic group.
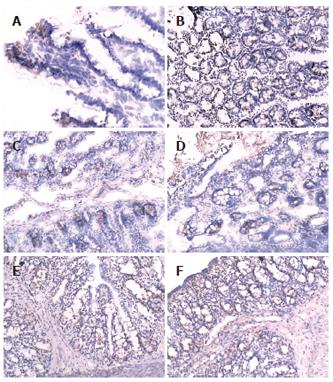
Figure 2 Intestinal and colon epithelial occludin expression.
A: Intestinal epithelium occludin expression in PN group (200 ×); B: decreased epithelium occludin expression in colon in PN group (200 ×); C: Intestinal epithelium occludin expression in probiotics group (200 ×); D: Colon epithelium occludin expression in probiotics group (200 ×); E: Intestinal epithelium occludin expression in probiotics group (200 ×); F: Colon epithelium occludin expression in probiotics group (200 ×).
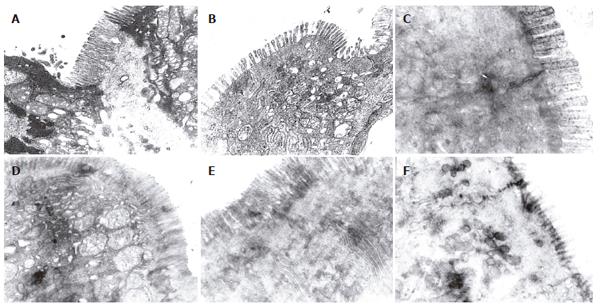
Figure 3 Ultra-structure of tight junction of the intestine and colon.
A: Tight junction of intestine in PN group (5000 ×); B: Tight junction of colon junction in PN group (5000 ×); C: Tight junction of intestine in EN group (5000 ×); D: Tight junction of the colon in EN group (5000 ×); E: Tight junction of intestine in probiotics group (5000 ×); F: Tight junction of the colon in probiotics group (5000 ×).
- Citation: Shen TY, Qin HL, Gao ZG, Fan XB, Hang XM, Jiang YQ. Influences of enteral nutrition combined with probiotics on gut microflora and barrier function of rats with abdominal infection. World J Gastroenterol 2006; 12(27): 4352-4358
- URL: https://www.wjgnet.com/1007-9327/full/v12/i27/4352.htm
- DOI: https://dx.doi.org/10.3748/wjg.v12.i27.4352


