Copyright
©2005 Baishideng Publishing Group Inc.
World J Gastroenterol. Oct 28, 2005; 11(40): 6249-6253
Published online Oct 28, 2005. doi: 10.3748/wjg.v11.i40.6249
Published online Oct 28, 2005. doi: 10.3748/wjg.v11.i40.6249
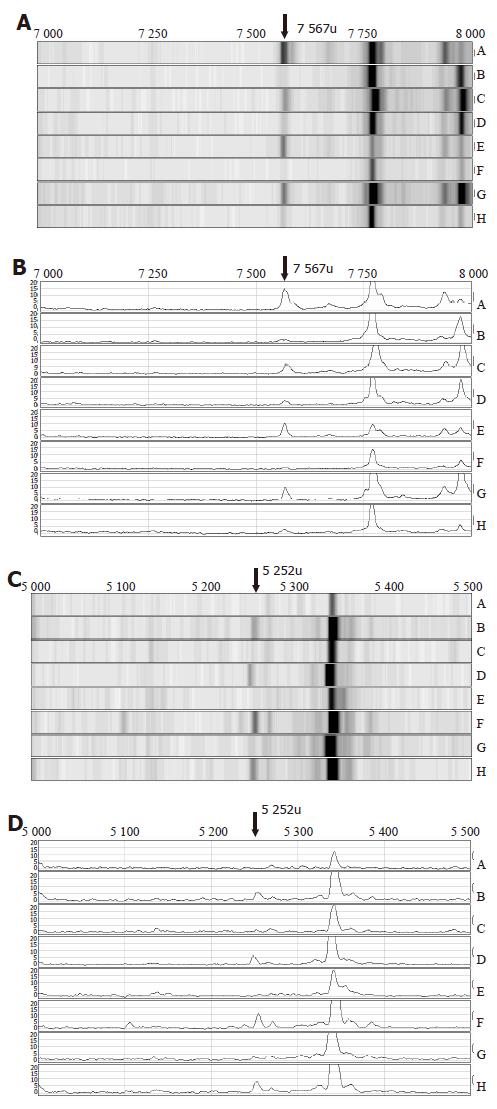
Figure 1 Detection of differentially expressed gastric cancer-associated serum proteins within a WCX2 chip.
The arrows direct to the potential cancer markers detected in the mass spectra, 7 567 u (A, B) and 5 252 u (C, D), which were significantly different in gastric cancer samples compared with healthy controls. A, C, E and G were gastric cancer samples and the others were controls. A and C: A stacked trace view of candidate markers from diseased vs control individuals. B and D: A representative pseudogel view of SELDI-TOF-MS analysis of serum samples.
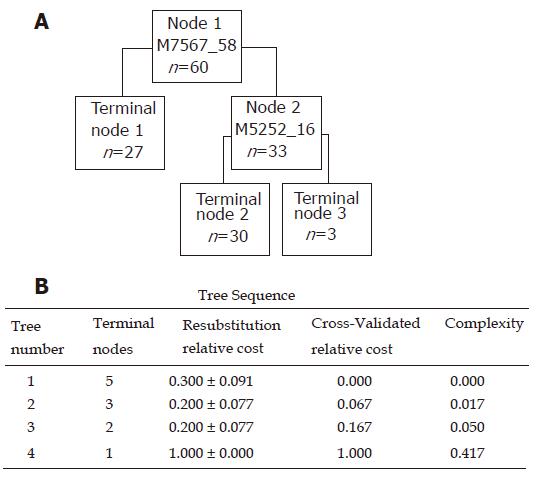
Figure 2 Model tree established by BPS using the training group and relative cost.
A: Two peaks, 7 567 and 5 252 u, were chosen to make the model tree. n represents the number of the samples that belong to the node; B: The relative cost of the model tree is 0.200.
- Citation: Qian HG, Jing-Shen, Ma H, Ma HC, Su YH, Hao CY, Xing BC, Huang XF, Shou CC. Preliminary study on proteomics of gastric carcinoma and its clinical significance. World J Gastroenterol 2005; 11(40): 6249-6253
- URL: https://www.wjgnet.com/1007-9327/full/v11/i40/6249.htm
- DOI: https://dx.doi.org/10.3748/wjg.v11.i40.6249


