Copyright
©The Author(s) 2005.
World J Gastroenterol. Aug 21, 2005; 11(31): 4918-4922
Published online Aug 21, 2005. doi: 10.3748/wjg.v11.i31.4918
Published online Aug 21, 2005. doi: 10.3748/wjg.v11.i31.4918
Figure 1 RT-PCR analysis of COX-2 mRNA in gastric tissues.
Lanes 1-4: gastric cancer; lanes 5 and 6: first-degree relatives; lanes 7 and 8: healthy control; lane 9: negative control; lane 10: 100-bp DNA ladder. T: Tumor; NT: adjacent non-tumor; C: corpus, and A: antrum.
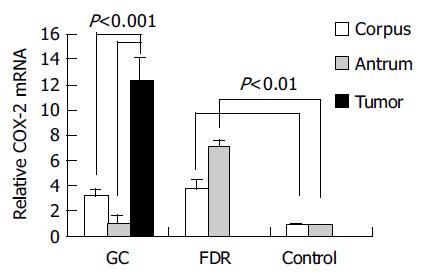
Figure 2 Quantitative RT-PCR analysis of COX-2 mRNA in gastric tissues.
GC: gastric cancer; FDR: first degree relatives.
Figure 3 COX-2 protein expression in gastric tissues.
T: Tumor; NT: adjacent non-tumor; C: corpus, and A: antrum.
- Citation: Zhang JT, Wang MW, Zhu ZL, Huo XH, Chu JK, Cui DS, Qiao L, Yu J. Increased expression of cyclooxygenase-2 in first-degree relatives of gastric cancer patients. World J Gastroenterol 2005; 11(31): 4918-4922
- URL: https://www.wjgnet.com/1007-9327/full/v11/i31/4918.htm
- DOI: https://dx.doi.org/10.3748/wjg.v11.i31.4918


