Copyright
©2005 Baishideng Publishing Group Inc.
World J Gastroenterol. May 28, 2005; 11(20): 3075-3079
Published online May 28, 2005. doi: 10.3748/wjg.v11.i20.3075
Published online May 28, 2005. doi: 10.3748/wjg.v11.i20.3075
Figure 1 Transmission electron microscopy of Cal-BSA-NP (A) and Cal-BSA-NP-GL (B) (×15000).
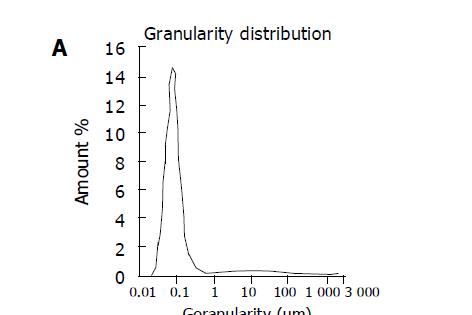
Figure 2 Diameter of Cal-BSA-NP (A) and Cal-BSA-NP-GL (B).
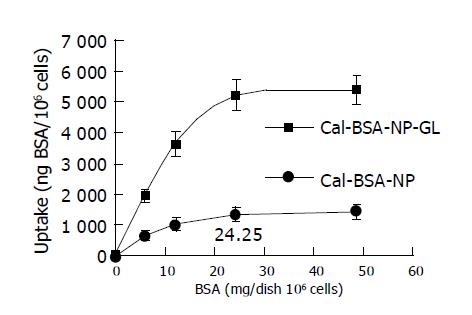
Figure 3 Dose-response curve of uptake of Cal-BSA-NP and Cal-BSA-NP-GL by primary cultured hepatocytes.
Figure 4 Time course of uptake of Cal-BSA-NP and Cal-BSA-NP-GL by primary cultured rat hepatocytes.
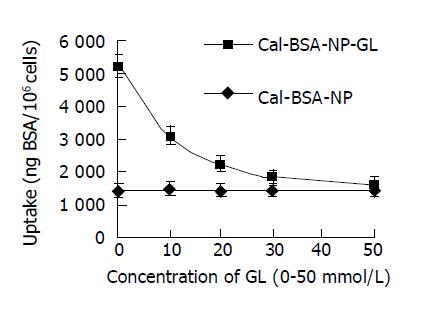
Figure 5 Inhibitory effect of GL on the uptake of Cal-BSA-NP-GL and Cal-BSA-NP by primary cultured rat hepatocytes.
- Citation: Mao SJ, Hou SX, He R, Zhang LK, Wei DP, Bi YQ, Jin H. Uptake of albumin nanoparticle surface modified with glycyrrhizin by primary cultured rat hepatocytes. World J Gastroenterol 2005; 11(20): 3075-3079
- URL: https://www.wjgnet.com/1007-9327/full/v11/i20/3075.htm
- DOI: https://dx.doi.org/10.3748/wjg.v11.i20.3075


