Copyright
©The Author(s) 2004.
World J Gastroenterol. Mar 15, 2004; 10(6): 819-824
Published online Mar 15, 2004. doi: 10.3748/wjg.v10.i6.819
Published online Mar 15, 2004. doi: 10.3748/wjg.v10.i6.819
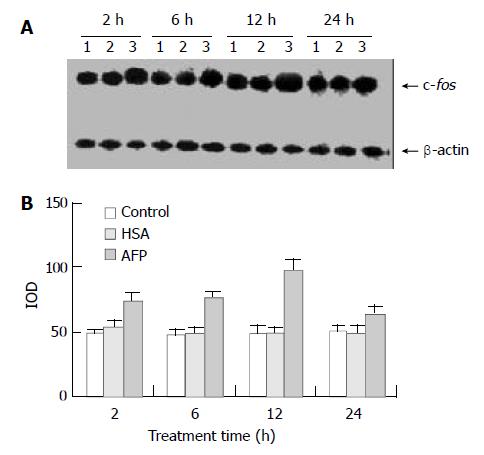
Figure 1 Effects of AFP (20 mg/L) or HSA (20 mg/L) on the expression of c-fos mRNA in human hepatocellular carcinoma Bel 7402 cells analyzed by Northern blot.
The cells were incu-bated with AFP or HSA for 2, 6, 12, and 24 h, respectively. A: Autoradiogram of Northern blot. Lane 1: control group; Lane 2: HSA treated group; Lane 3: AFP treated group. B: Densito-metric intensity of absorbance (IOD) of c-fos mRNA expres-sion in Bel 7402 cells. The data were selected from 3 indepen-dent experiments.
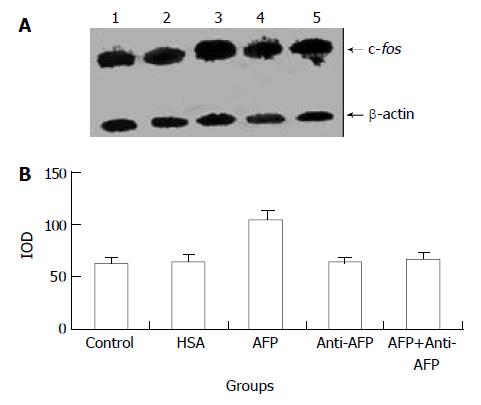
Figure 2 Effects of AFP (20 mg/L), HSA (20 mg/L), anti-AFP antibody (40 mg/L), and AFP (20 mg/L) + anti-AFP antibody (40 mg/L) on c-fos mRNA expression in human hepatocellular carcinoma Bel 7402 cells analyzed by Northern blot after 2 h treatment.
A: Autoradiogram of Northern blot. Lane 1: control group; Lane 2: HSA treated group; Lane 3: AFP treated group; Lane 4: anti-AFP antibody treated group; Lane 5: AFP + anti-AFP antibody treated group. B: Densitometric intensity of ab-sorbance (IOD) of c-fos mRNA expression in Bel 7402 cells. The data were selected from 3 independent experiments.
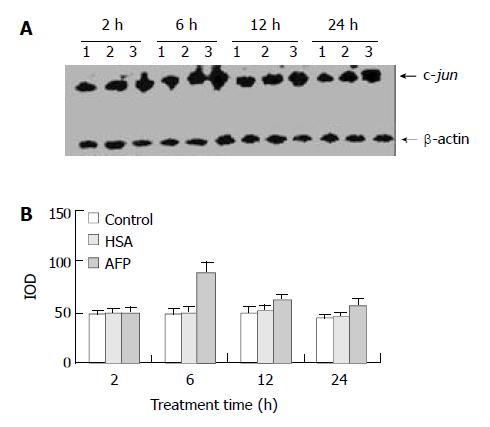
Figure 3 Effects of AFP (20 mg/L) or HSA (20 mg/L) on the expression of c-jun mRNA in human hepatocellular carcinoma Bel 7402 cells analyzed by Northern blot.
The cells were incu-bated with AFP or HSA for 2, 6, 12, and 24 h, respectively. A: Autoradiogram of Northern blot. Lane 1: control group; Lane 2: HSA treated group; Lane 3: AFP treated group. B: Densito-metric intensity of absorbance (IOD) of c-jun mRNA expres-sion in Bel 7402 cells. The data were selected from 3 similar experiments.
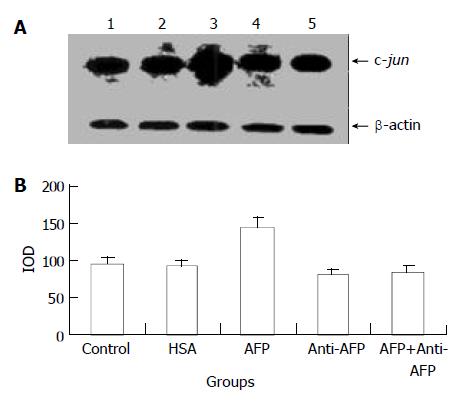
Figure 4 Effects of AFP (20 mg/L), HSA (20 mg/L), anti-AFP antibody (40 mg/L), and AFP (20 mg/L) + anti-AFP antibody (40 mg/L) on the expression of c-jun mRNA in human hepato-cellular carcinoma Bel 7402 cells analyzed by Northern blot after 6 h treatment.
A: Autoradiogram of Northern blot. Lane 1: control group; Lane 2: HSA treated group; Lane 3: AFP treated group; Lane 4: anti-AFP antibody treated group; Lane 5: AFP + anti-AFP antibody treated group. B: Densitometric intensity of absorbance (IOD) of c-jun mRNA expression in Bel 7402 cells. The data were selected from 3 independent experiments.
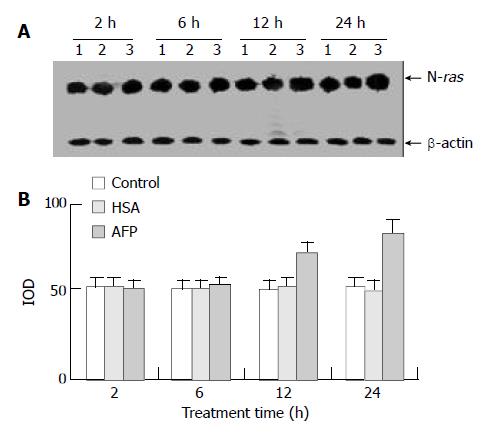
Figure 5 The effects of AFP (20 mg/L) or HSA (20 mg/L) on the expression N-ras mRNA in human hepatocellular carcinoma Bel 7402 cells analyzed by Northern blot.
The cells were incubated with AFP or HSA for 2, 6, 12, and 24 h, respectively. A: Autora-diogram of Northern blot. Lane 1: control group; Lane 2: HSA treated group; Lane 3: AFP treated group. B: Densitometric in-tensity of absorbance (IOD) of N-ras mRNA expression in Bel 7402 cells. The data were selected from 3 similar experiments.
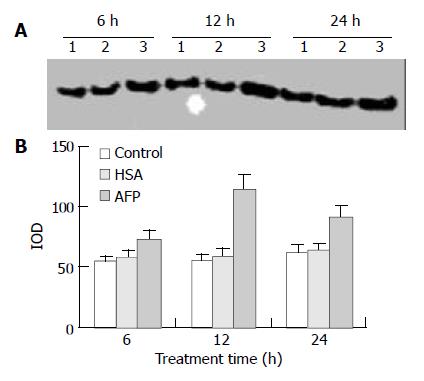
Figure 6 Effects of AFP (20 mg/L) or HSA (20 mg/L) on the expression of p21ras in Bel 7402 cells analyzed by Western blot.
The cells were incubated with AFP or HSA for 6, 12, and 24 h, respectively. A: Western blot analysis. Lane 1: control group; Lane 2: HSA treated group; Lane 3: AFP treated group. B: Den-sitometric intensity of absorbance (IOD) of p21ras protein. The data were selected from 3 similar experiments.
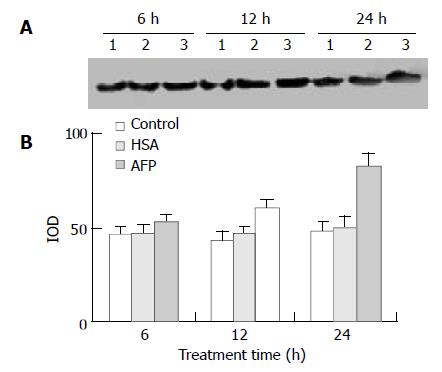
Figure 7 Effects of AFP (20 mg/L) or HSA (20 mg/L) on the expression of mutative p53 protein in Bel 7402 cells analyzed by Western blot.
The cells were treated with AFP or HSA for 6, 12, and 24 h, respectively. A: Western blot analysis. Lane 1: control group; Lane 2: HSA treated group; Lane 3: AFP treated group. B: Densitometric intensity of absorbance (IOD) of p53 protein. The data were selected from 3 similar experiments.
- Citation: Li MS, Li PF, Chen Q, Du GG, Li G. Alpha-fetoprotein stimulated the expression of some oncogenes in human hepatocellular carcinoma Bel 7402 cells. World J Gastroenterol 2004; 10(6): 819-824
- URL: https://www.wjgnet.com/1007-9327/full/v10/i6/819.htm
- DOI: https://dx.doi.org/10.3748/wjg.v10.i6.819


