Copyright
©The Author(s) 2004.
World J Gastroenterol. Feb 1, 2004; 10(3): 400-403
Published online Feb 1, 2004. doi: 10.3748/wjg.v10.i3.400
Published online Feb 1, 2004. doi: 10.3748/wjg.v10.i3.400
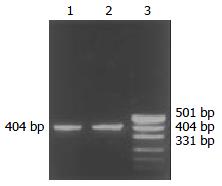
Figure 1 Electrophoretic results of PCR products.
1. GINaTK, 2. PA317/TK, 3. Marker (puc19DNA/MSP I).
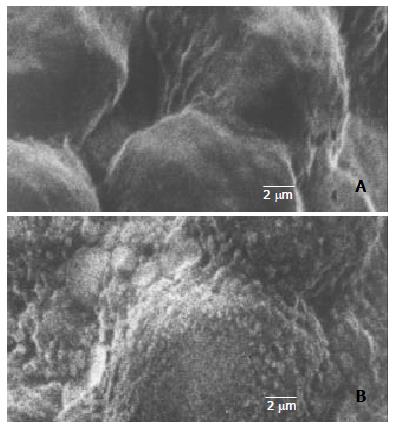
Figure 2 Results of scanning electron microscop.
A: The sur-face of PA317 cell are very smooth, B: There are a lot of bumps on the surface of PA317/TK cells because these gene- modified cells are secreting virus particles.
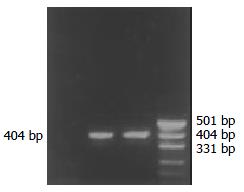
Figure 3 Results of RT-PCR.
1. SW1990, 2. SW1990/TK, 3. GINaTK, 4. Marker.
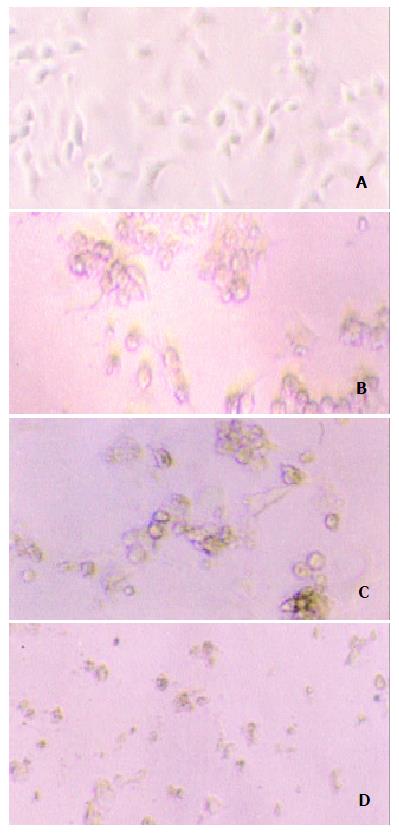
Figure 4 Typical morphological changes in SW1990/TK cells when exposed to GCV (50 μg/ml).
A: SW1990/TK cells with-out GCV. B: Two days after adding 50 μg/ml of GCV, cells became round and smaller, losing their normal morphology. C: Four days after adding GCV, cells gathered to balls. D: Five days later, cells clasped into small fragments.
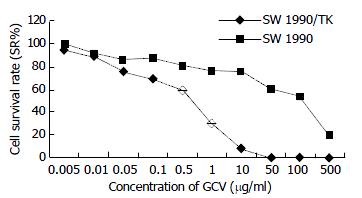
Figure 5 Sensitivity of SW1990/TK to GCV.
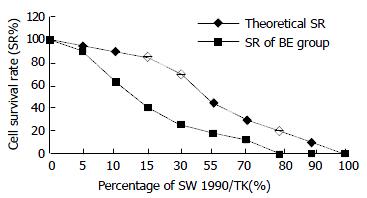
Figure 6 Bystander effects of SW1990/TK cell line.
- Citation: Wang J, Lu XX, Chen DZ, Li SF, Zhang LS. Herpes simplex virus thymidine kinase and ganciclovir suicide gene therapy for human pancreatic cancer. World J Gastroenterol 2004; 10(3): 400-403
- URL: https://www.wjgnet.com/1007-9327/full/v10/i3/400.htm
- DOI: https://dx.doi.org/10.3748/wjg.v10.i3.400


