Copyright
©The Author(s) 2004.
World J Gastroenterol. Jan 15, 2004; 10(2): 218-222
Published online Jan 15, 2004. doi: 10.3748/wjg.v10.i2.218
Published online Jan 15, 2004. doi: 10.3748/wjg.v10.i2.218
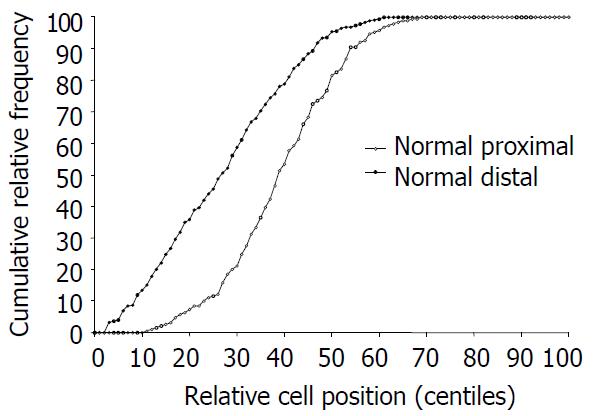
Figure 1 Different patterns of cumulative labelling distribu-tions in proximal and distal rat colons of normal controls.
The curve was significantly shifted to the right when the proximal colon was compared to the distal colon.
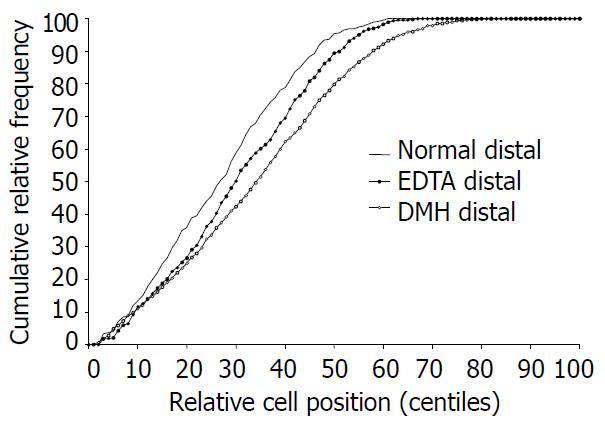
Figure 2 Cumulative labelling distribution in normal, EDTA and DMH treated distal rat colons, respectively.
The curve was significantly shifted to the right in EDTA distal colon compared to normal distal colons. The curve was further shifted to the right in DMH distal colon compared to either normal or EDTA distal colon.
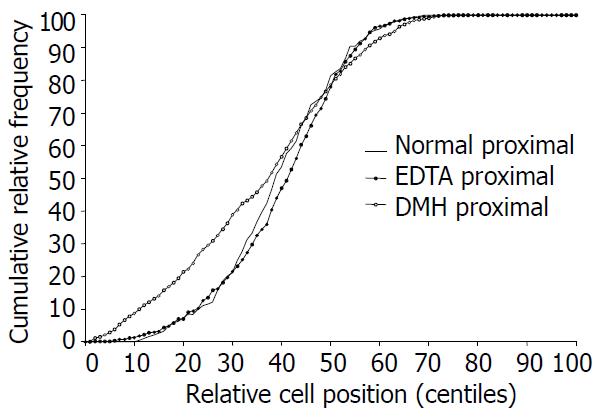
Figure 3 Cumulative labelling distribution in normal, EDTA and DMH treated proximal rat colons.
The curve of EDTA treated proximal rat colon did not change compared to the normal proximal curve. Whereas the curve of DMH treated proximal rat colon was initially significantly shifted to the left and then at higher centiles shifted to the right.
- Citation: Ma QY, Williamson KE, Rowlands BJ. Ethylene diamine tetraacetic acid induced colonic crypt cell hyperproliferation in rats. World J Gastroenterol 2004; 10(2): 218-222
- URL: https://www.wjgnet.com/1007-9327/full/v10/i2/218.htm
- DOI: https://dx.doi.org/10.3748/wjg.v10.i2.218


